Uncovering the Mystery of Fossil Butte: A Journey Through Science
170 likes | 292 Vues
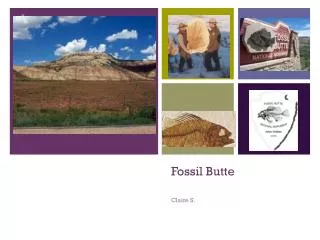
Discover the fascinating story behind Fossil Butte in Wyoming, where ancient fish and sea-dwelling creatures once thrived. This unique geological formation, more than 50 million years old, prompts intriguing questions about how these fossils ended up in a dry desert. Engage in scientific inquiry by exploring the scientific method, forming hypotheses, and designing experiments to investigate the presence of marine fossils in a landlocked area. Join us in understanding nature's history through observation, inference, and data analysis.

Uncovering the Mystery of Fossil Butte: A Journey Through Science
E N D
Presentation Transcript
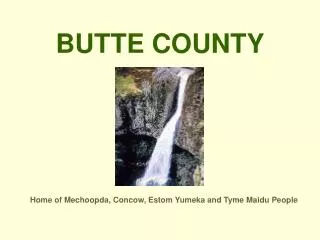
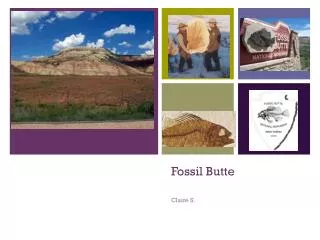
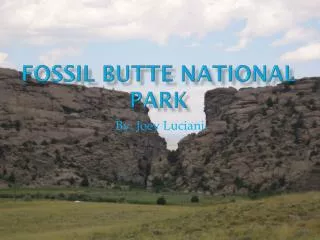
Understanding Fossil Butte In the southwest corner of Wyoming, there is a flat-topped mountain called Fossil Butte. A fossil of a fish was found near the top of the Fossil Butte in a rock formation that is about 50 million years old. Fossils of other kinds of fish, as well as turtles, have been found at Fossil Butte. The land around Fossil Butte is dry, and the Pacific Ocean is more than 1000km away. How could fossils of sea-dwelling animals have formed at Fossil Butte?
Understanding Fossil Butte • Working with a partner, think of several questions that a scientist might ask in order to understand why there are fish fossils in the desert of Wyoming. Write these questions on a sheet of paper. • Discuss your questions with your partner, and suggest a possible answer to each question. • How could a scientist go about fishing an answer to each of the questions?
WHAT IS SCIENCE? The Scientific Method & Parts of the Experiment
QUICK WRITE! • What do you know about the scientific method?
GOALS OF SCIENCE • Investigate and understand nature • Explain events in nature • Use those explanations to make useful predictions
The Scientific Method • There are FIVE main steps to the scientific method: • Stating the Problem • Forming a Hypothesis • Setting up a controlled experiment • Recording and analyzing the results • Drawing conclusions
STATING THE PROBLEM • This can be in the form of a question or statement. • Implies that an observation has been made to lead to a question… • Science is based on experimentation and observation • Observations can be: • Made directly with your senses • Color • Taste • Shape • Feel • Smell
INFERENCES • In contrast to observations, which are things that we see or measure, inferences are conclusions based solely on observation • The only rule of inferring is to be logical • They are always tentative, meaning, they are not final explanations • Usually changed when new information is gained, or observations are made
FORMING A HYPOTHESIS • A “testable” statement, a possible explanation that explains known facts and predicts new facts • Should be in the form • “If... then…” • Cause and Effect
DESIGNING AN EXPERIMENT • Must have several things: • VARIABLES • Experimental Group(s) • receives all of the conditions of the experiment • Independent (manipulated) Variable – one thing that is changed • Dependent (responding) Variable – measurable result of the independent variable • Control Group • receives all of the conditions of the experiment except one (the independent variable) • used as a means for comparison in the experiment • CONSTANTS • Factors in the experiment that are maintained throughout the experiment, they remain the SAME throughout • PROCEDURE • Must be clear and detailed
RECORDING & ANALYZING DATA • RECORDING DATA • Numerical data should be graphed and/or tabled • Observations should be written in clear, complete sentences. • TWO TYPES OF DATA • Qualitative – descriptive; a behavior or appearance • Quantitative – numerical data Data Table Independent variable (unit) Dependent variable (unit)
RECORDING & ANALYZING DATA • ANALYZING DATA • Attempt to figure out what the collected data means… why did it happen as it did? Graph Title: Dependent variable vs. Independent variable Dependent variable (unit) Independent variable (unit)
Graphing • Graph • A visual display of information or data • Three main types • LINE GRAPH • BAR GRAPH • PIE GRAPH
Line Graph • Shows how data changes over time or shows basic trends • Plotting data • Independent variable = x-axis • Dependent variable = y-axis
Bar Graph • Compares information collected by counting groups • Plotted the same as a line graph
Pie Graph • Shows how some fixed quantity is broken down into parts
FORM CONCLUSIONS • Be sure to draw conclusions based on the data collected. • Make inferences based on prior knowledge and the new knowledge gained in the experiment. • DO NOT restate the procedure or simply restate the results… • How do the results compare to your hypothesis? • How can this data be used further? • What other tests could be done?