Download
1 / 33
330 likes | 480 Vues
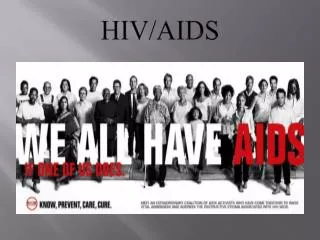
HIV & AIDS Cases in Alameda County. Presentation to the CCPC August 24, 2011 Elaine Bautista & Alex Marr. What is Epidemiology?. The study of the distributions (who, where and when) and determinants (what and why) of morbidity (sickness) and mortality (death) among human populations.

E N D
HIV & AIDS Cases in Alameda County Presentation to the CCPC August 24, 2011 Elaine Bautista & Alex Marr
What is Epidemiology? The study of the distributions (who, where and when) and determinants (what and why) of morbidity (sickness) and mortality (death) among human populations
AIDS Epidemiology Terminology • Proportion = Percent of cases • Incidence = new cases in time period • Prevalence = existing cases in time period • Cumulative = all cases ever reported regardless if alive or deceased
Rate • The occurrence of an event (disease), accounting for the size of the population • Infers a measure of time • Allows for comparisons of populations • The number of cases occurring during a specific time period divided by the population during that time period • Usually expressed per 1,000 or 100,000
Case Rate Number of cases Total Population Example: the rate in Alameda County for 2000 is: and the rate among African Americans in 2000 is: = Rate * 100,000 225___ 1,443,741 x 100,000 = 15.6 _127___ 211,124 = 60.2 x 100,000
Caveats – Potential Limitations • When stratified by race and sex, some HIV diagnostic values are too low to ascertain a case rate. We present the full race breakdown by percentage of new HIV diagnoses. However, we focused on the following three races with high enough counts for the 2006-2010 trend: • Latino • African American • White • As HIV surveillance by name was implemented in 2006, HIV diagnostic data before 2006 may not be comparable. • For the purposes of this presentation, cases (including transgender cases) are categorized by the Sex at birth.
HIV & AIDS Infections by Year of Diagnosis and Deaths among Persons with HIV Infection
Number of Newly Reported HIV (non-AIDS) Cases,Alameda County 2006-2010 Source: Centers for Disease Control and Prevention (CDC). eHARS. Atlanta, Georgia: U.S. Department of Health and Human Services, Centers for Disease Control and Prevention, [2006-2010].
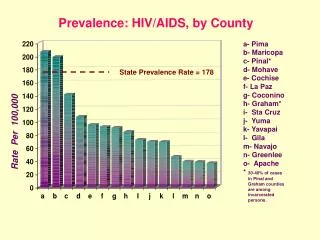
Annual HIV/AIDS Case rates by Race/Ethnicity and Year of Diagnosis
Percentage of Newly Reported HIV (non-AIDS) Cases By Race/Ethnicity, Alameda County 2006-2010 Source: Centers for Disease Control and Prevention (CDC). eHARS. Atlanta, Georgia: U.S. Department of Health and Human Services, Centers for Disease Control and Prevention, [2006-2010].
Percentage of Newly Reported HIV (non-AIDS) Cases By Race/Ethnicity, Alameda County 2006-2010 Source: Centers for Disease Control and Prevention (CDC). eHARS. Atlanta, Georgia: U.S. Department of Health and Human Services, Centers for Disease Control and Prevention, [2006-2010].
Newly Reported HIV/AIDS Infections by Reported Transmission Mode and Sex, Alameda County 2000-2010
Newly Reported HIV/AIDS Infections among Males by Reported Transmission Mode and Race/Ethnicity, Alameda County, 2000-2010 Latino Males
Newly Reported HIV/AIDS Infections among Females by Reported Transmission Mode by Race/Ethnicity, Alameda County, 2000-2010 Latina
Case Rates of Newly Reported HIV (non-AIDS) Cases by Race/Ethnicity,Alameda County 2006-2010 Source: Centers for Disease Control and Prevention (CDC). eHARS. Atlanta, Georgia: U.S. Department of Health and Human Services, Centers for Disease Control and Prevention, [2006-2010].
Case Rates of Newly Reported HIV (non-AIDS) Cases by Race/Ethnicity,Alameda County 2006-2010
Demographic Characteristics of PLWH/A *(Includes cases residing in Alameda County but diagnosed elsewhere)
Demographic Characteristics of PLWH/A *(Includes cases residing in Alameda County but diagnosed elsewhere)
Late Testers • The number of individuals who progress to AIDS within one year of initial HIV diagnosis. Includes those with HIV & AIDS simultaneous diagnosis. • As a % of AIDS Cases 3791 8038 = 47.2% • As a % of all HIV Positive Cases 3791 9451 = 40.1%
Percent Late Testers among each Demographic Characteristics (% of Group who were Late Testers)
Characteristics of Transgendered Persons in Alameda Co. # Cases
Conclusions • The number of diagnosed HIV cases surpassed the number of AIDS cases in 2010. • HIV/AIDS cases are predominantly among Males. Females comprise 15-20% of diagnosed cases. • African Americans comprise the majority of HIV/AIDS cases, followed by Whites and Latinos. • HIV/AIDS is diagnosed predominantly among individuals aged 20-49. A slight increase in older adults age 50 years and above has been seen in recent years. • New way of looking at Persons Living with HIV/AIDS to include new residents who were diagnosed elsewhere. • New ways of looking at late testers. The use of the data will depend on the completeness of the surveillance data and the message being conveyed.