Download

1 / 64
660 likes | 4.64k Vues
MR Evaluation of Bone Marrow Disorders. Nisha Patel, MD. Introduction. Nearly all imaging modalities evaluate the marrow, which is a site of significant pathology Radiography Nuclear Medicine CT MR. Topics of Discussion. Normal marrow anatomy and function MRI appearance of normal marrow

E N D
1. 1 MR Evaluation of Bone Marrow Disorders Nisha Patel, MD
2. 2 Introduction Nearly all imaging modalities evaluate the marrow, which is a site of significant pathology
Radiography
Nuclear Medicine
CT
MR
Conventional radiography traditionally first study but major disadvantage is poor soft tissue contrast and ;large amount of trabecular bone loss must occur before radiographically detectable. Late findings include cortical erosion, medullary sclerosis and cortical expansion.
Nucs- Tc99m diphosphonate and Su Colloid poor anatomic definition and nonspecific
CT more sensitive than CR but unable to differentiate normal from abnormal bone marrow
MR is most sensitive modality and that is what this talk will focus on todayConventional radiography traditionally first study but major disadvantage is poor soft tissue contrast and ;large amount of trabecular bone loss must occur before radiographically detectable. Late findings include cortical erosion, medullary sclerosis and cortical expansion.
Nucs- Tc99m diphosphonate and Su Colloid poor anatomic definition and nonspecific
CT more sensitive than CR but unable to differentiate normal from abnormal bone marrow
MR is most sensitive modality and that is what this talk will focus on today
3. 3 Topics of Discussion Normal marrow anatomy and function
MRI appearance of normal marrow
Benign and malignant marrow pathology
TODAY MY TALK WILL FOCUS ON THREE AREASTODAY MY TALK WILL FOCUS ON THREE AREAS
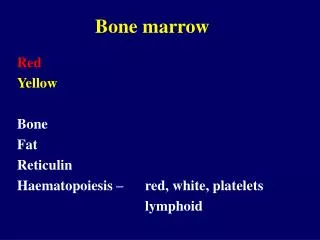
4. 4 Normal Marrow Anatomy and Function Three basic marrow components:
Trabeculae
Red marrow
Yellow marrow
THE BM IS COMPOSED OF THREE MAJOT COMPONENTS WHICH ARE...THE BM IS COMPOSED OF THREE MAJOT COMPONENTS WHICH ARE...
5. 5 Trabeculae Serve as the architectural support for the marrow and as a mineral depot.
Number of trabeculae decreases with age. This is a T1W coronal image of the ankle. Note the normal low signal stress trebeculae within the calcaneus and the normal low signal physeal scar.This is a T1W coronal image of the ankle. Note the normal low signal stress trebeculae within the calcaneus and the normal low signal physeal scar.
6. 6 Red Marrow Composed of hematopoietic cellular elements (red and white cells and platelets), supporting stroma (reticulum), and rich sinusoidal vascular supply
Smaller fraction of fat cells (40%)
It increases if the demand for hematopoiesis increases
7. 7 Yellow Marrow Smaller fraction of red marrow elements.
Larger fraction of fat cells (>50%)
Poor vascular supply
Paucity of reticulum
Increases with age
8. 8 Topics of Discussion Normal marrow anatomy and function
MRI appearance of normal marrow
Benign and malignant marrow pathology
NOW WE WILL TURN TO THE...NOW WE WILL TURN TO THE...
9. 9 MRI Appearance of Normal Marrow T1W SE and STIR are most commonly used sequences to evaluate the marrow.
In general, yellow marrow follows the signal intensity of subcutaneous fat, with relatively high signal on T1W images and low signal on STIR images.
Red marrow follows the signal intensity of muscle and has an intermediate signal intensity on T1W images and STIR images.
This a T1W coronal image of the knee and STIR image of the pelvis. Note the high signal intensity of the yellow marrow with its similar signal intensity to subcutaneous fat on T1 and lower signal on STIR and the intermediate signal intensity of the red marrow with its similar but higher intensity to muscle on T1 and STIR.This a T1W coronal image of the knee and STIR image of the pelvis. Note the high signal intensity of the yellow marrow with its similar signal intensity to subcutaneous fat on T1 and lower signal on STIR and the intermediate signal intensity of the red marrow with its similar but higher intensity to muscle on T1 and STIR.
10. 10 Marrow Conversion Amount and distribution of red and yellow marrow changes with time as well as in response to physiologic stresses
Normal conversion of red to yellow marrow occurs in a predictable and progressive manner
At birth, nearly the entire osseous skeleton is composed of red marrow.
Conversion proceeds from the appendicular (distal to proximal extremities) and then to the axial skeleton in a bilateral symmetric fashion.
THE BM IS A DYNAMIC ORGAN AND THE...THE BM IS A DYNAMIC ORGAN AND THE...
11. 11
12. 12 Marrow Conversion in Long Bones Infantile (0-1y)
Childhood (1-10y)
Adolescent (10-20y)
Adult (25+)
BM CONVERSION IN LONG BONES FOLLOWS 4 GENERAL PATTERNS. THIS IS A DIAGRAM DEMONSTRATING THE CONVERSION OF RED TO YELLOW MARROW.BM CONVERSION IN LONG BONES FOLLOWS 4 GENERAL PATTERNS. THIS IS A DIAGRAM DEMONSTRATING THE CONVERSION OF RED TO YELLOW MARROW.
13. 13 Infantile pattern 0-1 year
Homogeneous low signal marrow in diaphyses and metaphyses
THE INFANTILE PATTERN IS FOUND DURING THE FIRST YEAR OF LIFE AND IS CHARACTERIZED BY...
This a T1W coronal image of the pelvis. Note the intermediate signal intensity epiphyseal cartilage, high signal intensity ossific nucleus, and the low signal intensity red marrow.THE INFANTILE PATTERN IS FOUND DURING THE FIRST YEAR OF LIFE AND IS CHARACTERIZED BY...
This a T1W coronal image of the pelvis. Note the intermediate signal intensity epiphyseal cartilage, high signal intensity ossific nucleus, and the low signal intensity red marrow.
14. 14 Childhood pattern 1-10 year
Higher signal in diaphyses and metaphyses representing red? yellow marrow conversion THE CHILDHOOD PATTERN IS FOUND DURING AGES 1-10 AND IS CHARACTERIZED BY...
T1 Coronal image of a 2 yo and 6 yo which demonstrates increasing signal in the diaphyses and metaphyses signifying yellow marrow conversion and the fat marrow in the epi/apophysis
THE CHILDHOOD PATTERN IS FOUND DURING AGES 1-10 AND IS CHARACTERIZED BY...
T1 Coronal image of a 2 yo and 6 yo which demonstrates increasing signal in the diaphyses and metaphyses signifying yellow marrow conversion and the fat marrow in the epi/apophysis
15. 15 Adolescent pattern 11-20 year
Distal metaphyseal marrow converts to yellow marrow
Residual islands of red marrow leave a heterogeneous pattern to the metaphyseal marrow
IN AGES 11-20 THE ADOLESCENT PATTERN IS SEEN. DURING THIS TIME THE ...
Cor T1 Knee in a 14 yo girl shows the inhomogeneity of the distal metaphyseal marrowIN AGES 11-20 THE ADOLESCENT PATTERN IS SEEN. DURING THIS TIME THE ...
Cor T1 Knee in a 14 yo girl shows the inhomogeneity of the distal metaphyseal marrow
16. 16 Adult pattern 25 years +
Predominant homogeneous high signal diaphyseal and metaphyseal marrow
Hematopoietic marrow concentrated in the axial skeleton (skull, ribs, vertebra, sternum, pelvis) and to a lesser degree in the proximal appendicular skeleton (proximal femora and humeri) THE ADULT PATTERN IS CHARACTERIZED BY ...
Cor T1 Knee in 23 yo women with homogeneous fat marrow in distal M and ETHE ADULT PATTERN IS CHARACTERIZED BY ...
Cor T1 Knee in 23 yo women with homogeneous fat marrow in distal M and E
17. 17 Adult pattern After adult pattern reached, there is continued and gradual further replacement of hematopoietic marrow with fatty marrow
Spine and pelvis on T1 in elderly reflect this change
18. 18 Topics of Discussion Normal marrow anatomy and function
MRI appearance of normal marrow
Benign and malignant marrow pathology FINALLY MOVING ON TO THE DISCUSSION OF...FINALLY MOVING ON TO THE DISCUSSION OF...
19. 19 Bone Marrow Abnormalities Two USEFUL variables
Distribution of normal hematopoietic marrow
Has a characteristic distribution based on age and functional status
Thorough knowledge is important as any variation can represent disease
Signal intensity
Muscle or Disc serve as internal control
Normal marrow signal: isointense/hyperintense to muscle or disc on T1W
Diseased marrow: hypointense T1 signal compared to the muscle or disc BM ABNORMALITIES MAY BE THE FIRST INDICATION OF A FOCAL OR SYSTEMIC DISORDER AND CAREFUL EVALUATION IS NECESSARY.
PROCESSES RESULTING IN OBVIOUS SIGNAL ABNORMALITY ARE NOT DIFFICULT BUT DIFFERENTIATING SUBTLE ALTERATIONS AS NORMAL OR ABNORMAL CAN BE DIFFICULT ESPECIALLY WITH PATCHY HEMATOPOIETIC MARROW WHICH CAN SIMULATE A MALIGNANT PROCESS.
TO DIFFERENTIATE THESE, THERE ARE (TWO USEFUL VARIABLES WHICH ARE DISTRIBN AND SI).
AS I DISCUSSED ALREADY, (Normal hemat. Marrow...).
THE SECOND VARIABLE TO CONSIDER IF THE DISTRIBUTION IS NORMAL, IS SIBM ABNORMALITIES MAY BE THE FIRST INDICATION OF A FOCAL OR SYSTEMIC DISORDER AND CAREFUL EVALUATION IS NECESSARY.
PROCESSES RESULTING IN OBVIOUS SIGNAL ABNORMALITY ARE NOT DIFFICULT BUT DIFFERENTIATING SUBTLE ALTERATIONS AS NORMAL OR ABNORMAL CAN BE DIFFICULT ESPECIALLY WITH PATCHY HEMATOPOIETIC MARROW WHICH CAN SIMULATE A MALIGNANT PROCESS.
TO DIFFERENTIATE THESE, THERE ARE (TWO USEFUL VARIABLES WHICH ARE DISTRIBN AND SI).
AS I DISCUSSED ALREADY, (Normal hemat. Marrow...).
THE SECOND VARIABLE TO CONSIDER IF THE DISTRIBUTION IS NORMAL, IS SI
20. 20 Marrow Pathology Disorders of marrow proliferation
Disorders of marrow replacement
Disorders of marrow depletion
Vascular and Miscellaneous abnormalities DISEASE OF THE BM CAN BE CATGORIZED INTO 3 MAJOR GROUPS...
TWO OTHER CATEGORIES ARE...DISEASE OF THE BM CAN BE CATGORIZED INTO 3 MAJOR GROUPS...
TWO OTHER CATEGORIES ARE...
21. 21 Marrow Proliferative Disorders Arise from the proliferation of cells that normally exist in the marrow
Involve the marrow in a diffuse manner (except for focal multiple myeloma)
22. 22 Marrow proliferative disorders Benign
Marrow reconversion
Mastocytosis
Amyloidosis
Malignant
Polycythemia Vera
Myeloid Metaplasia with Myelofibrosis
Waldenstrom�s macroglobulinemia
MM
Leukemia THEY INCLUDE BOTH B9 AND MALIGNANT ETIOLOGIES
THEY INCLUDE BOTH B9 AND MALIGNANT ETIOLOGIES
23. 23 Marrow Reconversion Reconversion is due to increased demand for hematopoiesis.
Can be seen in hemolytic anemias, high level athletes, GCSF therapy, smokers, and destruction of red marrow. This is a diagram demonstrating the reconversion of yellow to red marrow. It is the reversal of the marrow conversion sequence.This is a diagram demonstrating the reconversion of yellow to red marrow. It is the reversal of the marrow conversion sequence.
24. 24 Marrow Reconversion The first image is a T1W sagittal image of the knee. Note the abnormal red marrow signal intensity within the distal femoral and proximal tibial diaphyses from sickle cell anemia with osteonecrosis in the tibia. The first image is a T1W sagittal image of the knee. Note the abnormal red marrow signal intensity within the distal femoral and proximal tibial diaphyses from sickle cell anemia with osteonecrosis in the tibia.
25. 25 Mastocytosis Rare disorder characterized by mast cell proliferation
Most commonly occurs as a skin manifestation (urticaria pigmentosa- generally a self-limited dermatologic disorder in children)
Systemic form rarer and involves the bone marrow and internal organs
Xrays
Lytic or sclerotic lesions in a focal or diffuse distribution
MR
Nonspecific pattern ranging from normal, focally/diffusely heterogeneous
Typically involves axial skeleton
26. 26 Mixed osteopenia and sclerosisMixed osteopenia and sclerosis
27. 27 Cor T1 and STIR showing heterogeneous/salt and pepper pattern of involvement
AP pelvis with diffuse marrow inv and HSMCor T1 and STIR showing heterogeneous/salt and pepper pattern of involvement
AP pelvis with diffuse marrow inv and HSM
28. 28 Myeloproliferative disorders Group of diseases
Polycythemia rubra vera
Agnogenic myeloid metaplasia (AMM) (Idiopathic myelofibrosis)
CML
Essential thrombocytopenia
Older patients (6th-8th decade)
Malignant transformation of pluripotent stem cells resulting in expansion of various BM elements
PV and AMM have similar MR appearance
Diffuse intermediate T1 signal
Myelofibrosis
Diffuse/Patchy sclerotic bone
Low T1 and T2 signal
29. 29 75 year old female with right shoulder pain and PV75 year old female with right shoulder pain and PV
30. 30 57 yo male, follow up R THA with diffuse smmetric patchy sclerosis on CT and Xray from Myelofibrosis57 yo male, follow up R THA with diffuse smmetric patchy sclerosis on CT and Xray from Myelofibrosis
31. 31 Another patient with patchy areas of sclerosis afffecting the pelvis (not involvement of femora as well as ischia) c/w myelofibrosisAnother patient with patchy areas of sclerosis afffecting the pelvis (not involvement of femora as well as ischia) c/w myelofibrosis
32. 32 Leukemia Acute: diffuse skeletal involvement
Chronic: (adults) involve areas of residual marrow in pelvis, spine, femurs
Involvement of the epiphyses/apophyses at any age reflects higher tumor burden
33. 33 This is a T1W sagittal image of the lumbar spine. Note the abnormal diffuse distribution of low marrow signal intensity from ALL and also that this signal is lower than the disc
This is a T1W sagittal image of the lumbar spine. Note the abnormal diffuse distribution of low marrow signal intensity from ALL and also that this signal is lower than the disc
34. 34 Multiple Myeloma (MM) Most common primary bone tumor
Solitary (plasmacytoma) form and more common multiple (myeloma) form
Xrays
Solitary lytic lesion or numerous focal punched out lesions
Generalized osteopenia
MRI patterns of MM in order of increasing frequency:
normal (low tumor burden)
focal lesion
heterogeneous (variegated)
homogenous (diffuse)
35. 35 This is a T1W and FSE T2W sagittal images of the lumbar spine. Note the heterogeneous/variegated pattern of involvement by MM. Do you see the FX?This is a T1W and FSE T2W sagittal images of the lumbar spine. Note the heterogeneous/variegated pattern of involvement by MM. Do you see the FX?
36. 36 Diffuse marrow involvement in lumbar spine. Note primarily cellular marrow demonstrating reversal of normal MR pattern, with diffuse hypointensity on T1-weighted spin-echo image, diffuse hyperintensity on STIR image, and marked enhancement on gadolinium-enhanced image. There is associated fracture of the T12 vertebral body. Diffuse marrow involvement in lumbar spine. Note primarily cellular marrow demonstrating reversal of normal MR pattern, with diffuse hypointensity on T1-weighted spin-echo image, diffuse hyperintensity on STIR image, and marked enhancement on gadolinium-enhanced image. There is associated fracture of the T12 vertebral body.
37. 37 Marrow Pathology Disorders of marrow proliferation
Disorders of marrow replacement
Disorders of marrow depletion
Vascular and Miscellaneous abnormalities THE NEXT CATEGORY IS...THE NEXT CATEGORY IS...
38. 38 Marrow Replacement Disorders Implantation of cells in the marrow that do not normally exist there
Usually focal lesions
MRI appearances include low T1 signal (equal or less than muscle or disc) and variable T2 signal (usually high, unless sclerotic). WHICH RESULTS IN...
In contrast to the marrow proliferative disorders, these affect bone in a focal rather than diffuse mannerWHICH RESULTS IN...
In contrast to the marrow proliferative disorders, these affect bone in a focal rather than diffuse manner
39. 39 Marrow Replacement Disorders Benign
Primary Bone tumors
Osteomyelitis
Malignant
Metastasis
Lymphoma
Malignant Bone tumors
THEY INCLUDE BOTH B9 AND MALIGNANT ETIOLOGIESTHEY INCLUDE BOTH B9 AND MALIGNANT ETIOLOGIES
40. 40 Metastasis Common primaries: breast, lung and prostate
Involve red marrow in spine, pelvis, prox femurs and humeri
Focal lesions with low T1 and high T2 and variable surr. edema
These are T1W and STIR sagittal images of the lumbar spine demonstrating low T1 and high STIR signal lesions, representing metastatic breast cancer. These are T1W and STIR sagittal images of the lumbar spine demonstrating low T1 and high STIR signal lesions, representing metastatic breast cancer.
41. 41 Lymphoma Primary lymphoma of bone rare
NHL > HD
Xray
Permeative and lytic
Appendicular skeleton in diaphyses of femur, tibia and humerus
T1W and STIR coronal images of the pelvis demonstrate foci of low T1 and high STIR signal representing NHL.T1W and STIR coronal images of the pelvis demonstrate foci of low T1 and high STIR signal representing NHL.
42. 42 Lytic permeative pattern. (a) Lateral radiograph of a 56-year-old woman shows permeative changes within the distal femur. (b) Coronal shows high signal intensity within the marrow and associated soft-tissue masses (arrows). (c) Sagittal contrast T1shows areas of enhancement within the intramedullary lesion and a soft-tissue mass off the posterior aspect of the femur (arrow). Lytic permeative pattern. (a) Lateral radiograph of a 56-year-old woman shows permeative changes within the distal femur. (b) Coronal shows high signal intensity within the marrow and associated soft-tissue masses (arrows). (c) Sagittal contrast T1shows areas of enhancement within the intramedullary lesion and a soft-tissue mass off the posterior aspect of the femur (arrow).
43. 43 T1W and STIR coronal images of the pelvis and lspine demonstrate foci of low T1 and high STIR signal representing NHL.
T1W and STIR coronal images of the pelvis and lspine demonstrate foci of low T1 and high STIR signal representing NHL.
44. 44 Marrow Pathology Disorders of marrow proliferation
Disorders of marrow replacement
Disorders of marrow depletion
Vascular and Miscellaneous abnormalities THE LAST CATEGORY IS...THE LAST CATEGORY IS...
45. 45 Marrow Depletion Disorders Due to ablation of red marrow elements
Involvement can be diffuse or regional in distribution
3 main causes include chemotherapy, radiation, and aplastic anemia
MRI appearances follow the signal intensity of fat
46. 46 Chemotherapy Systemically destroys normal hematopoietic marrow and tumor cells
1st week post chemo
Edematous and hypocellular marrow
Post 1st week
Progressive fat replacement of marrow (similar to untreated aplastic anemia) THE SPECIFIC APPEARANCE OF BM FOLLOWING CHEMORX DEPENDS UPON HOW SOON AFTER IMAGING IS PERFORMED...
THE SPECIFIC APPEARANCE OF BM FOLLOWING CHEMORX DEPENDS UPON HOW SOON AFTER IMAGING IS PERFORMED...
47. 47 This is a T1W sagittal lumbar spine demonstrating abnormal diffuse distribution of high signal intensity marrow, which is similar in intensity to fat. DX? Chemotherapy This is a T1W sagittal lumbar spine demonstrating abnormal diffuse distribution of high signal intensity marrow, which is similar in intensity to fat. DX? Chemotherapy
48. 48 Aplastic Anemia Acquired (infections, drugs, toxins) or congenital causes (Fanconi, TAR Sx, etc)
MR
Classic description
Diffuse fat replacement of marrow
Foci of low T1 signal may represent
Residual islands of red marrow
Post Rx regenerative marrow
Development of MDS/Leukemia
49. 49 This is a T1W coronal view of the pelvis demonstrating diffuse abnormal distribution of high T1 signal intensity marrow. Do you see another DX besides aplastic anemia? Bilateral AVN
This is a T1W coronal view of the pelvis demonstrating diffuse abnormal distribution of high T1 signal intensity marrow. Do you see another DX besides aplastic anemia? Bilateral AVN
50. 50 T1 and STIR showing ham marrow in GCSF pt. W/O such hx would consider regen marrow residual marrowT1 and STIR showing ham marrow in GCSF pt. W/O such hx would consider regen marrow residual marrow
51. 51 Radiation Acute and Chronic induced changes
MR appearance of radiated marrow depends on phase in which it was imaged and dose
1st 2 weeks: Increased STIR with slight increase in T1
3rd-6th weeks: heterogeneous signal
>6th weeks: chronic changes of fat replacement
Dose < 30 Gy may have regeneration after 1 year
Dose >30-40 Gy irreversible changes
The effects of radiation induced changes in bone marrow can be divided into acute and chronic. This is a pt with chronic radiation changes on a T1W sagittal image of the lumbar spine demonstrating hypoplasia and abnormal high T1 signal intensity marrow of the lower lumbar and sacral vertebrae. The effects of radiation induced changes in bone marrow can be divided into acute and chronic. This is a pt with chronic radiation changes on a T1W sagittal image of the lumbar spine demonstrating hypoplasia and abnormal high T1 signal intensity marrow of the lower lumbar and sacral vertebrae.
52. 52 PreRx, 3 days, 46 days STIR demonstrating acute edema early followed by decreased signal laterPreRx, 3 days, 46 days STIR demonstrating acute edema early followed by decreased signal later
53. 53 This is a pt with chronic radiation changes on a T1W sagittal image of the lumbar spine demonstrating hypoplasia and abnormal high T1 signal intensity marrow of the lower lumbar and sacral vertebrae.
This is a pt with chronic radiation changes on a T1W sagittal image of the lumbar spine demonstrating hypoplasia and abnormal high T1 signal intensity marrow of the lower lumbar and sacral vertebrae.
54. 54 Marrow Vascular and Miscellaneous Abnormalities Vascular
Hyperemia and Ischemia
Transient and regional migratory osteoporosis
RSD
Osteonecrosis
Trauma
Infection
Tumors
Joint abnormalities (degenerative or neuropathic arthropathy)
Other
Storage diseases: Glycogen (Gaucher�s) or Iron
Paget�s disease
Osteopetrosis
55. 55 Transient Osteoporosis of the Hip Painful process that affects mainly young and middle age men in either hip or pregnant women more commonly in the left hip
Osteoporosis can be severe enough to cause an insufficiency fracture
MR
Homogeneous Focal/Diffuse well marginated edema
May spare medial and/or lateral margins of femoral head +/- greater trochanter
Occasional acetabular edema
Small-moderate joint effusion
56. 56 Transient Osteoporosis of the Hip
This is a coronal STIR image of the pelvis demonstrating an abnormal high signal intensity focus within the right proximal femur and associated hip effusion, representing TOH.
This is a coronal STIR image of the pelvis demonstrating an abnormal high signal intensity focus within the right proximal femur and associated hip effusion, representing TOH.
57. 57 Regional Migratory Osteoporosis Similar MRI and clinical features as TOH
Not confined to the hip and migratory in nature
Subchondral regions of the knee, ankle, and hip each may be affected in turn This is a STIR coronal image of the knee demonstrating abnormal high signal intensity marrow and soft tissue, representing RMO.This is a STIR coronal image of the knee demonstrating abnormal high signal intensity marrow and soft tissue, representing RMO.
58. 58 Two sets of images taken 3 months apart, consisting of T1 and T2FS. 1st shows edema in cuboid with linear low signal which thought to represent an insuff fx. 2nd shows resolution of cuboid edema with new ankle joint effusion and talar body edema and talar dome insuff fx.Two sets of images taken 3 months apart, consisting of T1 and T2FS. 1st shows edema in cuboid with linear low signal which thought to represent an insuff fx. 2nd shows resolution of cuboid edema with new ankle joint effusion and talar body edema and talar dome insuff fx.
59. 59 Marrow Ischemia (Osteonecrosis) Synonymous terms
AVN (Focal lesions in the epiphyses)
Bone infarct ( Metaphysis or diaphysis)
Causes
Trauma, steroids, HbS, SLE, Gaucher disease, ETOH, pancreatitis, and idiopathic
NEXT WE TURN TO LESIONS OF MARROW ISCHEMIA OR OSTEONECROSIS
This is a T1w sagittal image of the knee. What is the DX? Osteonecrosis.
NEXT WE TURN TO LESIONS OF MARROW ISCHEMIA OR OSTEONECROSIS
This is a T1w sagittal image of the knee. What is the DX? Osteonecrosis.
60. 60 Xray and MR- patchy sclerosis and lucency in a serpiginous pattern Xray and MR- patchy sclerosis and lucency in a serpiginous pattern
61. 61 Gaucher Disease Rare lysosomal storage disease leading to the accumulation of glucocerebroside within the RES
MR
Focal/Diffuse hypointensity on T1 and T2
Active disease hyperintense on T2 FS and STIR
Lumbar spine involved first followed by appendicular skeleton
62. 62 Gaucher Disease Treatment includes administration of the deficient enzyme
MRI can be used to monitor treatment demonstrating decreased marrow infiltration on serial exams in those who are responding This is a STIR of the pelvis. Note the abnormal high signal intensity within the left hip and right acetabulum and the underlying diffuse low signal intensity marrow, representing Gaucher disease. Is there another focus of osteonecrosis?
T1W coronal image of the femora demonstrating normal marrow distribution in this patient with gaucher disease after Rx. The Erlenmeyer flask deformities of the femora remain.This is a STIR of the pelvis. Note the abnormal high signal intensity within the left hip and right acetabulum and the underlying diffuse low signal intensity marrow, representing Gaucher disease. Is there another focus of osteonecrosis?
T1W coronal image of the femora demonstrating normal marrow distribution in this patient with gaucher disease after Rx. The Erlenmeyer flask deformities of the femora remain.
63. 63 Summary Bone marrow disorders have a nonspecific MR appearance but remembering the categories of diseases and correlating this with clinical history can be helpful
Marrow Proliferative
Marrow Replacement
Marrow Depletion
Vascular/Miscellaneous
Two useful characteristics for evaluating marrow disorders
Distribution
Normal marrow conversion and reconversion patterns
Signal Intensity (muscle and disc serve as internal standard)
Normal marrow: same or higher signal
Abnormal marrow: lower signal
64. 64 References Clinical Magnetic Resonance Imaging, Edelman et al, 2006.
Bone and Joint Disorders, Resnick et al, 2005
Moore et al. Red and Yellow Marrow in the femur: age related changes in appearance at MR Imaging. Radiology 175: 219-223, 1984.
Vande Berg et al.: Classification and detection of bone marrow lesions with magnetic resonance imaging. Skeletal Radiology 27: 529-545, 1998.
Vande Berg et al.: Magnetic Resonance Imaging of the bone marrow in hematologic malignancies. Eur Radiology 8:1335-1344, 1998.
Parisi et al.: Complication of cancer therapy in children: A radiologist�s guide. Radiographics 19:283-297, 1999.
Kaplan et al: Bone marrow patterns in aplastic anemia observations with 1.5T MR imaging. Radiology 164:441-444, 1987.
Kaplan et al: Polycythemia Vera and Myelofibrosis:correlation of MR, clinical, and laboratory findings, Radiology 183:329-334, 1992.
Avila et al.: Mastocytosis: magnetic resonance imaging patterns of bone marrow disease, Skeletal Radiology 27:119-126, 1998.
Stacy E. Smith et al. From the Archives of the AFIP: Radiologic Spectrum of Paget Disease of Bone and Its Complications with Pathologic Correlation. RadioGraphics 2002; 22: 1191.