Download
1 / 26
260 likes | 287 Vues
Learn how the MIMOSA project develops statistical models to estimate migration flows and improves data quality in the EU. Explore the methodologies used and the significance of accurate migration data. Discover the next steps for improving migration estimation.

E N D
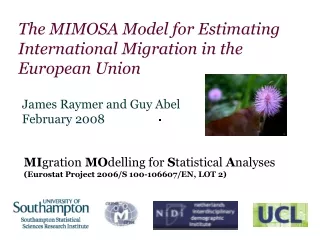
The MIMOSA Model for Estimating International Migration in the European Union James Raymer and Guy Abel February 2008 MIgration MOdelling for Statistical Analyses (Eurostat Project 2006/S 100-106607/EN, LOT 2)
MIMOSA project • Aim of project • Development and application of statistical modelling techniques for the estimation of missing data on migration flows and foreign population stocks • Work with National Statistical Agencies to improve their data • Funded by Eurostat, December 2006-2009 • Netherlands Interdisciplinary Demographic Institute (Coordinator) • Central European Forum for Migration and Population Research • Southampton Statistical Sciences Research Institute • GéDAP, Université Catholique de Louvain • Focus of this presentation: Migration flow estimation
Significance • The study of international migration in the European Union is currently hindered by data availability, quality and consistency • Harmonization of data collection processes and the data they generate is not even close to being realized, therefore our understanding of population change and migration policy is therefore currently limited • To overcome these obstacles, we need models to (i) harmonise and correct for inadequacies in the available data and (ii) estimate the missing patterns
Data used in this study • Provided by Eurostat (i.e., data comes from the Joint Questionnaire on International Migration) • Immigration and emigration flows by previous / next country of residence (32 by 32 matrix) • 31 European countries: EU plus Iceland, Liechtenstein, Norway and Switzerland • Rest of world • Years: 2002, 2003, 2004 and 2005
Double-entry matrix for selected countries, 2003 I = Receiving country’s reported flow; E = sending country’s reported flow; … = no reported data available
Double-entry matrix for selected countries, 2003 I = Receiving country’s reported flow; E = sending country’s reported flow; … = no reported data available
Double-entry matrix for selected countries, 2003 I = Receiving country’s reported flow; E = sending country’s reported flow; … = no reported data available
Data • Only partial data exists between 2001 and 2004; • Italics: No data exists between 2001 and 2004
Methodology • Harmonise and clean available data • Identify base data (DK, FI, SE and NO) • Calculate adjustment ratios and adjust reported data by using iterative procedure • Estimate missing data • Immigration and emigration totals for European matrix • Associations between origins and destinations
Step 1 of iterative adjustment procedure: Identify and adjust base data Note, procedure applied to 2002-2005 data pooled over time
Step 2 of iterative adjustment procedure: Calculate adjustment ratios Note, procedure applied to 2002-2005 data pooled over time
Step 3 of iterative adjustment procedure: Add adjusted flows to base data Note, procedure applied to 2002-2005 data pooled over time
Adjustment factors for receiving country (I) and sending country (E) migration data, 2002-2005
Estimated coefficients for regressions on natural logarithms of available immigration and emigration flows from / to EU matrix and rest of world (n = 59)
Multiplicative component model Origin by destination migration flow table Multiplicative components where
Estimating the ODij assocations • ODij = reported to expected flows • Expected flows obtained using iterative proportional fitting (IPF) and estimated margins from EU matrix • Two sets of ODij • Available data • Missing data:
Estimated coefficients for regression on available origin-destination associations within the EU matrix (n=2540)
Estimated migration totals, 2002-2005: within the EU matrix and from / to rest of world
Top 20 estimated immigration and emigration countries (in thousands), 2002-2005 Immigration Emigration
Summary • To produce an overall picture of EU migration, one has to address issues concerning the availability, quality and consistency of migration data • Harmonisation and cleaning of reported data • Estimation of missing data (marginal totals and origin-destination associations) based on patterns found in available data and covariates
Next steps • Much research still needed • Integration • EM and Bayesian methods • Standard errors of estimates • MIMOSA project • Flows by age, sex and citizenship • Flows to be linked to population estimates and change