Download
1 / 1
10 likes | 159 Vues
Remote Sensing of High Latitude Open Cell Convection Todd D. Sikora, Millersville University G. S. Young, Pennsylvania State University C. M. Fisher, Pennsylvania State University M. D. Stepp, Millersville University. P2.1. Background. Climatology. Case Studies.

E N D
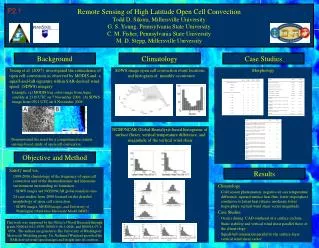
Remote Sensing of High Latitude Open Cell ConvectionTodd D. Sikora, Millersville University G. S. Young, Pennsylvania State University C. M. Fisher, Pennsylvania State University M. D. Stepp, Millersville University P2.1 Background Climatology Case Studies • Young et al. (2007) investigated the coincidence of open cell convection as observed by MODIS and a squall-and-lull signature within SAR-derived wind speed (SDWS) imagery • Example, (a) MODIS true color image from Aqua satellite at 2310 UTC on 7 November 2006; (b) SDWS image from 0301 UTC on 8 November 2006 • Demonstrated the need for a comprehensive remote sensing-based study of open cell convection SDWS image open cell convection event locations and histogram of monthly occurrence • Morphology NCEP/NCAR Global Reanalysis-based histograms of surface fluxes, vertical temperature difference, and magnitude of the vertical wind shear Objective and Method • Satisfy need via: • 1999-2006 climatology of the frequency of open cell convection and of the thermodynamic and kinematic environment surrounding its formation • SDWS images and NCEP/NCAR global reanalysis data • 24 case studies from 2006 focused on the detailed morphology of open cell convection • SDWS images, MODIS images, and University of Washington’s Real-time Mesoscale Model (MM5) Results • Climatology • Cold season phenomenon, negative air-sea temperature difference, upward surface heat flux, lower troposphere conducive to latent heat release, moderate lower troposphere vertical wind shear vector magnitude • Case Studies • Occurs during CAD southeast of a surface cyclone • Static stability and vertical wind shear parallel those of the climatology • Squall-lull orientation parallel to the surface-layer vertical wind shear vector This work was supported by the Office of Naval Research through grants N00014-04-1-0539, N00014-06-1-0046, and N00014-07-1-0934. The authors are grateful to The University of Washington Mesoscale Modeling group. Dr. Nathaniel Winstead provided the SAR-derived wind speed images and insight into its creation.


![[Image Similarity Based on Histogram]](https://cdn0.slideserve.com/1309335/image-similarity-based-on-histogram-dt.jpg)


![[Image Similarity Based on Histogram]](https://cdn5.slideserve.com/9279474/image-similarity-based-on-histogram-dt.jpg)