Download
1 / 21
210 likes | 385 Vues
MODEL OF DEMAND. The model of demand is an attempt to explain the amount demanded of any good or service. DEMAND DEFINED. The amount of a good or service a consumer wants to buy, and is able to buy per unit time. THE “STANDARD” MODEL OF DEMAND.

E N D
MODEL OF DEMAND • The model of demand is an attempt to explain the amount demanded of any good or service. DEMAND DEFINED The amount of a good or service a consumer wants to buy, and is able to buy per unit time. TitleDemand
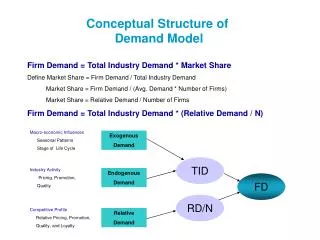
THE “STANDARD” MODEL OF DEMAND • The DEPENDENT variable is the amount demanded. • The INDEPENDENT variables are: • the good’s own price • the consumer’s money income • the prices of other goods • preferences (tastes) • expectations TitleDemand
YOU COULD WRITE THE MODEL THIS WAY: • The demand for lemon-lime • QD(lemon-lime) = D(Plemon-lime, Income, • Ppeanuts, Pcola, tastes, expectations) TitleDemand
ECONOMISTS HAVE HYPOTHESES ABOUT HOW CHANGES IN EACH INDEPENDENT VARIABLE AFFECT THE AMOUNT DEMANDED TitleDemand
THE DEMAND CURVE • The demand curve for any good shows the quantity demanded at each price, holding constant all other determinants of demand. • The DEPENDENT variable is the quantity demanded. • The INDEPENDENT variable is the good’s own price. TitleDemand
THE LAW OF DEMAND • The Law of Demand says that a decrease in a good’s own price will result in an increase in the amount demanded, holding constant all the other determinants of demand. • The Law of Demand says that demand curves are negatively sloped. TitleDemand
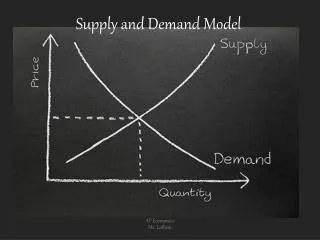
A DEMAND CURVE • A demand curve must look like this, i.e., be negatively sloped. own price demand quantity demanded Market for lemon-lime TitleDemand
p0 Q0 The demand curve means: You pick a price, such a p0, and the demand curve shows how much is demanded. own price demand quantity demanded Market for lemon-lime TitleDemand
What if the price of lemon-lime were less than p0?How do you show the effect on demand? Go to hidden slide TitleDemand
AN IMPORTANT POINT • When drawing a demand curve notice that the axes are reversed from the usual convention of putting the dependent (y) variable on the vertical axis, and the independent (x) variable on the horizontal axis. TitleDemand
Other factors affecting demand • The question here is how to show the effects of changes in income, other goods’ prices, and tastes on demand. TitleDemand
Suppose people want to buy more of a good when incomes rise, holding constant all other factors affecting demand, including the good’s own price. own price How does this affect the demand curve? $1/can demand @ I = $1000 quantity of lemon-lime Market for lemon-lime TitleDemand Go to hidden slide
Normal and inferior goods defined • Normal good: When an increase in income causes an increase in demand. • Inferior good: When an increase in income causes a decrease in demand. TitleDemand
Lemon-lime is a normal good. What’s the effect on the demand curve for lemon-lime if income rises to $2,000? own price demand @ I = $1000 quantity Market for lemon-lime Go to hidden slide TitleDemand
Suppose instead that lemon-lime was an inferior good. own price What’s the effect on the demand curve for lemon-lime if income rises to $2,000? demand @ I = $1000 quantity Market for lemon-lime Go to hidden slide TitleDemand
Substitutes defined • Substitutes: Two goods are substitutes if an increase in the price of one of them causes an increase in the demand for the other. • Thus, an increase in the price of cola would increase the demand for lemon-lime if the goods were substitutes. TitleDemand
The graph shows the demand curve for lemon-lime when colas cost $1 each. own price What’s the effect of an increase in the price of cola to $1.50? demand @ cola price of $1 quantity Market for lemon-lime Go to hidden slide TitleDemand
Complements defined • Complements: Two goods are complements if an increase in the price of one of them causes a decrease in the demand for the other. • Thus, an increase in the price of peanuts would decrease the demand for lemon-lime if the goods were complements. TitleDemand
The graph shows the demand curve for lemon-lime when peanuts cost $2 each. price of lemon-lime What is the effect on the market for lemon-lime of an increase in the price of peanuts to $3? demand @ peanuts price of $2 quantity Market for lemon-lime TitleDemand Go to hidden slide
The graph shows the demand curve for umbrellas on sunny days. What’s the effect on demand of it being a rainy day? price of umbrellas demand on sunny days quantity Market for umbrellas TitleDemand Go to hidden slide
DEMAND SUMMARY • Demand is a function of own-price, income, prices of other goods, and tastes. • The demand curve shows demand as a function of a good's own price, all else constant. • Changes in own-price show up as movements along a demand curve. • Changes in income, prices of substitutes and complements, expectations, and tastes show up as shifts in the demand curve. TitleDemand