Download

1 / 20
200 likes | 227 Vues
Explore the updated measurement data of the warm snake in bldg. 902, including temperature rise, thermo-graphic data, water flow rates, magnetic field simulations, beam trajectories, and error studies. Analyzed data offers insights on correcting beam trajectory with current and shims, optimizing magnetic flux, and addressing model errors. Dive into detailed findings on magnet measurements and stay tuned for integral data analysis updates from Jan 29, 2004 by Junpei Takano.

E N D
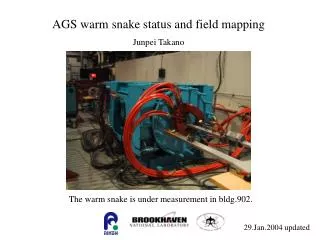
AGS warm snake status and field mapping Junpei Takano The warm snake is under measurement in bldg.902. 29.Jan.2004 updated
Temperature rise 37 ℃ 20 ℃ Thermo graphic data @ 2700Amp. It is no problem within this temperature.
Temperature rise Average temperature rise = 10.5 ℃ @ total water flow rate = 185 gal/min Calculated data: temperature rise = 14.8 ℃ @ total water flow rate = 162 gal/min This calculated value include some safety margin.
Magnetic field on the z-axis This graph is the simulated data by using OPERA_3D.
Simulated beam trajectory L1 = 39 [cm], L2 = 132 [cm] P1 = 90 [cm/rev] , P2 = 184 [cm/rev] these parameters were optimized L1, P1 L2, P2 L1, P1 offset = 0 offset = 0 deflection angle = 0 This beam trajectory is perfect !
Beam trajectory ~ depending on the energy ~
Measured magnetic field This graph shows the Field Angle. It is almost fine.
Error study However these beam trajectories are the result of the ideal simulated model. The actual magnet has some errors. The main errors which should be considered are: B-H curve of the steel Packing factor of the laminations Dimensional errors because of the lamination pressing Deformation of the yoke Coil position error → The model which is completely like the actual magnet must be simulated.
Beam trajectory ~ depending on the current ~ Current = 80% to 110% The operation current is one of the method for correcting the beam trajectory.
Beam trajectory The Beam output position will change on this way, if the shims are put on the pole piece.
Measured magnetic field These plots are the measured data without shims.
The harmonic coil data shows 97% of the actual magnetic flux because of probe length. In actually the magnetic flux is 1.52T. Measured magnetic field The plot of the perfect model is calculated data by using OPERA_3D The simulated data was analyzed by using virtual harmonic coil on OPERA.
Measured magnetic field The actual model plot is the simulated data which model include some errors.
Beam trajectory This is the beam trajectory of the actual model. The output beam has offset and deflection angle. This beam trajectory was optimized by using matrix.
The result of the matrix about the current and shims are: current = 94.5% shims = 0.7 This trajectory is the output with 95% current and a shim. Beam trajectory Magnetic flux at the center of the magnet is 1.46 Tesla.
Measured magnetic field The optimized simulation data is similar to the plot of the perfect model. Next slide shows zoom up of this plots.
Measured magnetic field Measurement data with 3 shims
Measured magnetic field Comparing to the perfect model. The warm snake is under correctable.
Summary The magnetic flux is more powerful than simulation model at full current. But the beam trajectory is under control with current and shims. Currently the magnet is measured by using integral coil probe. I heard the integral data is good. The data will be coming up soon. And I am analyzing the measured magnetic field. These slides are the latest up date data. I’ll send the newest analyzed data to you. Thank you so much for taking care for me. 29.Jan.2004 Jun