Download
1 / 48
480 likes | 600 Vues
Explore the stock and flow of blood and marrow transplants from 1987 to 2006, including patient survival rates, demographic distributions, and transplant types.

E N D
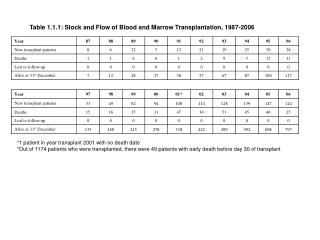
Table 1.1.1: Stock and Flow of Blood and Marrow Transplantation, 1987-2006 *1 patient in year transplant 2001 with no death date *Out of 1174 patients who were transplanted, there were 49 patients with early death before day 30 of transplant
New patients Alive at 31st Dec 800 700 600 500 Number of patients (n) 400 300 200 100 0 1987 1989 1991 1993 1995 1997 1999 2001 2003 2005 1988 1990 1992 1994 1996 1998 2000 2002 2004 2006 Year Figure 1.1.1: Stock and Flow of Blood and Marrow Transplantation, 1987-2006
Table 1.1.2: New Transplant Rate per million population (pmp), 1987-2006
6 5 4 New transplant rate pmp 3 2 1 0 1987 1989 1991 1993 1995 1997 1999 2001 2003 2005 1988 1990 1992 1994 1996 1998 2000 2002 2004 2006 Year Figure 1.1.2: New Transplant Rate per million population (pmp), 1987-2006
Table 1.1.3: Distribution of Patients by Centre, 1987-2006 Note: Distribution is according to transplant centre *Others include Royal Perth Hospital
KLA KLP UKM SJA UMA KLP UMA UMP 150 140 130 120 110 100 90 80 Number of patients (n) 70 60 50 40 30 20 10 0 1993 1987 1989 1991 1995 1997 1999 2001 2003 2005 1988 1990 1992 1994 1996 1998 2000 2002 2004 2006 Year Figure 1.1.3: Distribution of Patients by Centre, 1987-2006
SJP LWE GMC others Hospital Ampang ASH 150 140 130 120 110 100 90 80 70 Number of patients (n) 60 50 40 30 20 10 0 1987 1989 1991 1993 1995 1997 1999 2001 2003 2005 1988 1990 1992 1994 1996 1998 2000 2002 2004 2006 Year Figure 1.1.3: Distribution of Patients by Centre, 1987-2006
Male Female 100 80 60 Percentage of patients (%) 40 20 0 1987 1989 1991 1993 1995 1997 1999 2001 2003 2005 Year Figure 1.2.1: Distribution of Patients by Gender, 1987-2006
Table 1.2.2: Distribution of Patients by Ethnic Group, 1987-2006
Figure 1.2.2: Distribution of Patients by Ethnic Group, 1987-2006 Malay Chinese Indian Bumiputra Sabah Bumiputra Sarawak Others 100 90 80 70 Percentage of patients (%) 60 50 40 30 20 10 0 1987 1989 1991 1993 1995 1997 1999 2001 2003 2005 Year
Table 1.2.3: Distribution of Patients by Age Group, 1987-2006
Table 1.2.3: Distribution of Patients by Age Group, 1987-2006 *Age=date of transplant – date of birth
0-9 years 10-19 years 20-39 years 40-59 years ≥60 years 100 90 80 70 Percentage of patients (%) 60 50 40 30 20 10 0 1987 1989 1991 1993 1995 1997 1999 2001 2003 2005 Year Figure 1.2.3: Distribution of Patients by Age Group, 1987-2006
Table 1.2.4: Distribution of Patients by Primary Diagnosis, 1987-2006
Table 1.2.4: Distribution of Patients by Primary Diagnosis, 1987-2006
Table 1.3.1: Distribution of Patients by Graft Number, 1987-2006
Graft number 1 Graft number 2 Graft number 3 100 80 Percentage of patients (%) 60 40 20 0 1987 1989 1991 1993 1995 1997 1999 2001 2003 2005 Year Figure 1.3.1: Distribution of Patients by Graft Number, 1987-2006
Table 1.3.2: Distribution of Patients by Transplantation Type, 1987-2006 Note: 6 patients with syngeneic type of transplant
Allogeneic + Syngeneic Autologous 140 120 100 Number of patients (n) 80 60 40 20 0 1987 1989 1991 1993 1995 1997 1999 2001 2003 2005 Year Figure 1.3.2: Distribution of Patients by Transplantation Type, 1987-2006
Table 1.3.3: Type of transplant by Centre, 1987-2006 * Others include Royal Perth Hospital
Allogeneic + Syngeneic Autologous 280 260 240 220 200 180 160 140 Number of patients (n) 120 100 80 60 40 20 0 KLA UKM UMA GMC SJP Ampang KLP SJA UMP LWE ASH Others Centre Figure 1.3.3: Type of transplant by Centre, 1987-2006
Table 1.3.4: Source of Transplant, 1987-2006 PBSC = Peripheral Blood Stem Cells
Marrow PBSC / Marrow+ PBSC Cord blood/ Marrow + cord 140 120 100 80 Number of patients (n) 60 40 20 0 1987 1989 1991 1993 1995 1997 1999 2001 2003 2005 Year Figure 1.3.4: Source of Transplant, 1987-2006
Table 1.3.5: Distribution of Patients by HLA Match, 1987-2006 *excluding autologous
Table 1.3.6: Distribution of Patients by Allogeneic Donor Relationship, 1987-2006
Table 1.3.6: Distribution of Patients by Allogeneic Donor Relationship, 1987-2006 *excluding autologous, including syngeneic
Table 1.4.1: Distribution of Patients by Cause of Death, 1987-2006
Table 1.4.1: Distribution of Patients by Cause of Death, 1987-2006 Note: 1 patient with missing cause of death reported
1.00 0.75 0.50 Cumulative survival 0.25 0.00 0 1 2 3 4 5 6 7 8 9 10 11 12 13 14 15 16 17 18 19 20 Duration in years Year 1987-1992 Year 1993-1998 Year 1999-2006 Figure 1.4.1: Patient Survival by Year of Transplant, 1987-2006
1.00 0.75 0.50 Cumulative survival 0.25 0.00 0 1 2 3 4 5 6 7 8 9 10 11 12 13 14 15 16 17 18 19 20 Duration in years Male Female Figure 1.4.2: Patient Survival by Gender, 1987-2006
1.00 0.75 Cumulative survival 0.50 0.25 0.00 0 1 2 3 4 5 6 7 8 9 10 11 12 13 14 15 16 17 18 19 20 Duration in years 0-9 years 10-19 years 20-39 years ≥40 years Figure 1.4.3: Patient Survival by Age Group, 1987-2006
1.00 0.75 Cumulative survival 0.50 0.25 0.00 0 1 2 3 4 5 6 7 8 9 10 11 12 13 14 15 16 17 18 19 20 Duration in years Allogeneic + Syngeneic Autologous Figure 1.4.4: Patient Survival by Type of Transplant, 1987-2006
1.00 0.75 Cumulative survival 0.50 0.25 0.00 0 1 2 3 4 5 6 7 8 9 10 11 12 13 14 15 16 17 18 19 20 Duration in years Allogeneic Autologous Figure 1.5.1: Disease-free Survival for Acute Myeloid Leukaemia, 1987-2006 (Allogeneic vs. Autologous)
1.00 0.75 Cumulative survival 0.50 0.25 0.00 0 1 2 3 4 5 6 7 8 9 10 11 12 13 14 15 16 17 18 19 20 Duration in years Allogeneic Figure 1.5.2: Disease-free Survival for Acute Lymphoblastic Leukaemia,1987-2006 (Allogeneic)
1.00 0.75 Cumulative survival 0.50 0.25 0.00 0 1 2 3 4 5 6 7 8 9 10 11 12 13 14 15 16 17 18 19 20 Duration in years Allogeneic Figure 1.5.3: Disease-free Survival for Thalassaemia, 1987-2006 (Allogeneic)
1.00 0.75 Cumulative survival 0.50 0.25 0.00 0 1 2 3 4 5 6 7 8 9 10 11 12 13 14 15 16 17 18 19 20 Duration in years Allogeneic Autologous Figure 1.5.4: Disease-free Survival for Non-Hodgkin’s Lymphoma, 1987-2006 (Allogeneic vs. Autologous)
1.00 0.75 Cumulative survival 0.50 0.25 0.00 0 1 2 3 4 5 6 7 8 9 10 11 12 13 14 15 16 17 18 19 20 Duration in years Autologous Figure 1.5.5: Disease-free Survival for Hodgkin’s Disease, 1987-2006 (Autologous)
1.00 0.75 Cumulative survival 0.50 0.25 0.00 0 1 2 3 4 5 6 7 8 9 10 11 12 13 14 15 16 17 18 19 20 Duration in years Allogeneic Figure 1.5.6: Disease-free Survival for Chronic Myeloid Leukaemia, 1987-2006(Allogeneic)
1.00 0.75 Cumulative survival 0.50 0.25 0.00 0 1 2 3 4 5 6 7 8 9 10 11 12 13 14 15 16 17 18 19 20 Duration in years Allogeneic Figure 1.5.7: Disease-free Survival for Aplastic Anaemia, 1987-2006 (Allogeneic)
1.00 0.75 0.50 Cumulative survival 0.25 0.00 0 1 2 3 4 5 6 7 8 9 10 11 12 13 14 15 16 17 18 19 20 Duration in years Paediatric Adult Figure 1.5.8: Disease-free Survival by Age Group for Acute Myeloid Leukaemia,1987-2006 Paediatric is defined as age 18 years and adult age >18 years
1.00 0.75 Cumulative survival 0.50 0.25 0.00 0 1 2 3 4 5 6 7 8 9 10 11 12 13 14 15 16 17 18 19 20 Duration in years Paediatric Adult Figure 1.5.9: Disease-free Survival by Age Group for Acute Lymphoblastic Leukaemia,1987-2006 Paediatric is defined as age 18 years and adult age >18 years
1.00 0.75 0.50 Cumulative survival 0.25 0.00 0 1 2 3 4 5 6 7 8 9 10 11 12 13 14 15 16 17 18 19 20 Duration in years Paediatric Figure 1.5.10: Disease-free Survival by Age Group for Thalassaemia, 1987-2006 * No adult cases reported for Thalassaemia Paediatric is defined as age 18 years and adult age >18 years
1.00 0.75 Cumulative survival 0.50 0.25 0.00 0 1 2 3 4 5 6 7 8 9 10 11 12 13 14 15 16 17 18 19 20 Duration in years Paediatric Adult Figure 1.5.11: Disease-free Survival by Age Group for Non-Hodgkin’s Lymphoma,1987-2006 Paediatric is defined as age 18 years and adult age >18 years
1.00 0.75 Cumulative survival 0.50 0.25 0.00 0 1 2 3 4 5 6 7 8 9 10 11 12 13 14 15 16 17 18 19 20 Duration in years Paediatric Adult Figure 1.5.12: Disease-free Survival by Age Group for Hodgkin’s Disease,1987-2006 Paediatric is defined as age 18 years and adult age >18 years
1.00 0.75 Cumulative survival 0.50 0.25 0.00 0 1 2 3 4 5 6 7 8 9 10 11 12 13 14 15 16 17 18 19 20 Duration in years Paediatric Adult Figure 1.5.13: Disease-free Survival by Age Group for Chronic Myeloid Leukaemia,1987-2006 Paediatric is defined as age 18 years and adult age >18 years
1.00 0.75 Cumulative survival 0.50 0.25 0.00 0 1 2 3 4 5 6 7 8 9 10 11 12 13 14 15 16 17 18 19 20 Duration in years Paediatric Adult Figure 1.5.14: Disease-free Survival by Age Group for Aplastic Anaemia,1987-2006 Paediatric is defined as age 18 years and adult age >18 years