Download
1 / 20
200 likes | 829 Vues
z-scores & t-scores (unit 2). Review Normal Curve, Deviation Scores, Standard Deviation z-scores for scores (x) Standard Scores Describing distance in standard deviation units z-scores for sample means (x bar ) t-scores for sample means when σ x is unknown, and you estimate based on ŝ x

E N D
z-scores & t-scores (unit 2) • Review • Normal Curve, Deviation Scores, Standard Deviation • z-scores for scores (x) • Standard Scores • Describing distance in standard deviation units • z-scores for sample means (xbar) • t-scores for sample means • when σx is unknown, and you estimate based on ŝx • Purpose • Means to determine how extreme x or xbar is • Foundation of hypothesis testing Unit 2: z, t, hyp, 2t
Review • Normal Curve • Most distributions fit bell-curve pattern • More extreme scores less frequent • x’s (scores) deviate around μ (population average) • Deviation Scores • distance of score from mean; foundation for standard deviation • Bob has an IQ of 120, when the average IQ is 100 • score – mean OR x – xbar OR x - μ • large deviation scores (pos or neg) extreme (unlikely) score • Standard Deviations • typical deviation found within a distribution • typical distance a given score falls from the mean • The standard deviation for IQ is 15, and the mean is 100 Unit 2: z, t, hyp, 2t
Normal Curve (with raw scores and standard scores) μ 12 σ Few Extreme Scores Few Extreme Scores Unit 2: z, t, hyp, 2t
Relation between SDs and Percent of Scores Unit 2: z, t, hyp, 2t
Check-up: Reading the Normal Curve • What’s the μ for female height? • What’s the σ for IQ? • What’s the σ for Anxiety? • The most typical 68% of females are between ___ and ___ inches tall. • 99% of people will fall within what range of anxiety scores? • 95% of people are between what two IQ scores? • What’s the standard deviation for f. height? • Which variable has the largest stand. dev.? • Which scores, on each variable, fall at –3 Stand. Dev.? • What percent of scores fall between 0 and –1 S.D.? Unit 2: z, t, hyp, 2t
Check-up: Basic Concepts • Contrast Deviation score & Standard Deviation Score • What does it mean about a score if it falls near the end of the distribution? • If you describe the location of a score in the tail of the distribution with a standard score, what sort of value would the standard score have? • Which standard score would be more surprising, -1, +4, 0, or –3? Unit 2: z, t, hyp, 2t
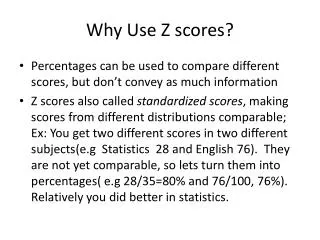
Standard Scores: z-scores • z-scores • standard scores • location of score on standard normal curve (where μ=0 and σ=1) • distance between score and mean in std. dev. units • indicates “how extreme” Unit 2: z, t, hyp, 2t
Understanding the z-score formula • Deviation Score • “Difference Observed” • Standard Deviation • “Difference Expected” Unit 2: z, t, hyp, 2t
History Test #1 Unit 2: z, t, hyp, 2t
History Test #2 Unit 2: z, t, hyp, 2t
Questions about previous slide • Estimating with inter-occular method • What % of people score at 75 or below on test #2? • What % of people score at 75 or better on test #2? • What percent of people score 80 or below on test #1? • What percent of people score 80 or above on test #1? • Using z-score tables (found in back of text book) • What % of people score at 77 or below on test #2? • What % of people score at 77 or above on test #2? • What percent of people score 82 or below on test #1? • What percent of people score 82 or above on test #1? Unit 2: z, t, hyp, 2t
Possible z-score conversions Unit 2: z, t, hyp, 2t
Sampling Distributions • “Distributions”– what we’ve been using so far for z-scores • Frequency distributions of scores – x’s • Z tells distance x falls from μ • e.g., Your SAT score • How does your score compare to the pop. mean? • “Sampling Distributions” – new type of z-scores • Distribution of sample means – xbars • Z tells distance xbar falls from μ • e.g. The average score SAT of 4 psyc majors • How does the sample mean compare to the pop. mean? • Which has less variability? • If you’re estimating travel time to Charleston, do you ask 1 person or 5 people? • As variability decreases, prediction accuracy_______. Unit 2: z, t, hyp, 2t
n=1 n=4 Population Why Use Sampling Distributions? Samples More Accurate! Pulling out scores: x’s x= 550, 450, 600, 525, 675, etc. use σx Pulling out sample means : M= 530, 480, 540, 510, 490 SAT Scores μ = 500 • Sample means have less variability!!!! • Sample means better predictors of μ!!! • Use Standard Error of the mean: σxbar Unit 2: z, t, hyp, 2t
Bottom-Line • We use samples in research because they better represent the populations than individual scores do. • Standard Error of the Mean • Definition: • Typical deviation of sample means around the population mean • Measure of variability in a sampling distribution • Symbol: • Formula: Unit 2: z, t, hyp, 2t
Comparing frequency and sampling distributions Unit 2: z, t, hyp, 2t
Frequency Distribution z-score Unit 2: z, t, hyp, 2t
Sampling Distribution z-score Unit 2: z, t, hyp, 2t
Graphing Frequency Distribution What’s always in the center? What measure of variability? This distance equals what? Unit 2: z, t, hyp, 2t
Graphing Sampling Distribution What’s always in the center? What measure of variability? This distance equals what? Unit 2: z, t, hyp, 2t