Mastering Measurement Essentials: Accuracy, Bias, Reliability
Understand the fundamentals of measurement, including validity, predictive validity, and accuracy. Learn how to enhance reliability by taking averages of repeated measurements. Explore real-world examples like Apgar scores and moon diameter measurements.

Mastering Measurement Essentials: Accuracy, Bias, Reliability
E N D
Presentation Transcript
Before we begin . . . • On a piece of paper give your best estimates: • How many airplanes will be in the sky over the United States today? • How many school buses are operational in the U.S.?
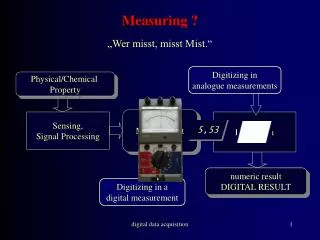
Measurement essentials • Measurement is the value of a variable for a single element • Systolic blood pressure is the variable • 120 mmHg (millimeters of mercury) is the measurement • Millimeters of mercury are the units • Validity • Predictive validity • Accuracy • Bias • Reliability (or Precision) • Random error
Validity • A measurement is valid if it is an appropriate representation of the property of interest • Suppose you learned that U of M graduated more students who eventually became millionaires than either Carleton or St. Olaf. Would that be a fair comparison? How should the numbers be presented in order to make it a fair comparison? • Often the rate (or percent) is more valid that a count of occurrences • August 4, 1998: Dow Jones drops 300 points, “the third biggest drop ever” (Associate Press) • In fact the decline was 3.7% • There have been 215 bigger one-day percentage drops • Dow Jones is now high (about 9,000) because of many factors • Investors are more concerned with percentages, not points
Predictive validity • In social sciences often difficult to decide if a measurement is valid • Are SATs a valid measure of college achievement? • Are IQs a valid measure of intelligence? • A measurement has predictive validity if it can be used to adequately predict some outcome related to the property of interest • How well do SATs predict college grades? • Actually, not so well! Studies show a weak correlation. • “Restricted range” problem: Most Carleton students have high SATs so the correlation with college grades is lower than it would be if there was more low SAT scores! • How would you measure the “well-being” of society? • Traverse City, Michigan’s “qualify of life” index counts bird and frog species as a (partial) measure of the health of the environment • Tucson, Arizona counts pedestrians in its neighborhoods because people feel safer when other people are on the streets
Accuracy and bias • Measuring weight on a bathroom scale • Valid, but is it accurate? • My scale is always off 5 pounds • Monday’s weight = true weight + 5 lbs + 0.25 lbs • Tuesday’s weight = true weight + 5 lbs – 0.5 lbs • Wednesday’s weight = true weight + 5 lbs + 0.75 lbs • Two kinds of error: bias and random error • Measured value = true value + bias + random error
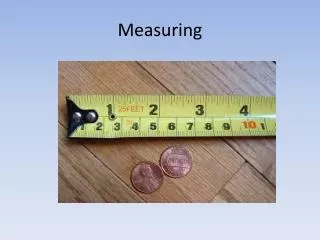
Accuracy of Measurement • Measure the length of your (paperback) textbook to the nearest tenth of a unit. • Do it on your own and don’t look at your neighbor’s answer • Write down the result and hand it in • Is the measure valid, biased, reliable? • What do the data show? measurements.sav
Reliability/Precision • A BIG idea: To improve reliability take averages of several measurements • The average of several repeated measurements is less variable than a single measurement.
Apgar scores are a measurement of an infant’s overall health taken a few minutes after birth. The score ranges from 0 (dead) to 10 (“perfect health”) and is based on tests of the baby’s heart and breathing rate, muscle tone, etc. (APGAR stands for Activity, Pulse, Grimmace, Appearance, Respiration.) A critic gives three reasons why the Apgar score isn’t a perfect measurement: Reason I – There are important facets of health that aren’t measured by the score. Reason II – A doctor’s rating may be affected by being present at the birth; often giving unwarranted low values to babies whose birth was difficult. Reason III – Two different doctors may give different Apgar scores, even when measuring the same baby at the same time. Which of these criticisms argue about the validity of the Apgar score? Which of these criticisms argue about the reliability? Which of these criticisms argue about the bias in the measurement? Suppose two doctors both judge an infant’s health using the Apgar system and the average of their two values is taken as the “official” Apgar score. Will this improve the validity, reliability, and/or bias of the measurement?
The diameter of the moon is measured four times independently by a process that is free of bias. The measurements came out 2157, 2166, 2162, and 2155 miles, which average out to 2160 miles. One more measurement is about to be taken using the same process. When compared with the estimate of 2160 miles, you would expect this next measurement to be [ more, just as, less ] accurate as a measure of the true diameter of the moon. • The age of a pine tree was measured five times using a new electronic probe inserted in the tree’s trunk. The measured values were 43, 40, 45, 44, and 41 years old. Later this tree was cut down and by counting the growth rings, it was determined that the tree was really 34 years old. Does this new device for measuring the age of trees have a greater problem with bias or with precision?
What’s a valid measure of the effectiveness of cancer treatment? • Total deaths from cancer • 1970: 331,000 • 1990: 505,000 • 1998: 539,000 • Percent of all Americans who die from cancer • 1970: 17.2% • 1990: 23.5% • 1998: 23.0% • Percent of cancer patients who survive for 5 years from the time disease was discovered (5 year survival rate) • 1974-76: 50.3% • 1989-95: 60.9%