Supplemental material and method
Supplemental material and method Ag-presenting CpG -activated pDCs prime Th17 cells that induce tumor regression Leslie Guéry , Juan Dubrot , Carla Lippens , Dale Brighouse , Pauline Malinge , Magali Irla, Caroline Pot, Jean-Marc Waldburger, and Stéphanie Hugues

Supplemental material and method
E N D
Presentation Transcript
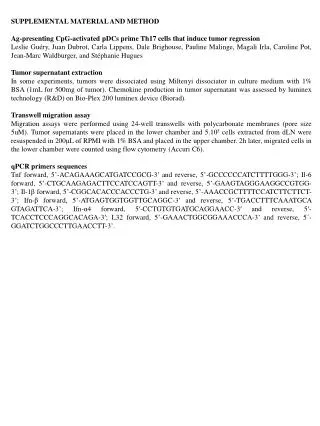
Supplemental material and method Ag-presenting CpG-activated pDCs prime Th17 cells that induce tumor regression Leslie Guéry, Juan Dubrot, Carla Lippens, Dale Brighouse, Pauline Malinge, MagaliIrla, Caroline Pot, Jean-Marc Waldburger, and StéphanieHugues Tumor supernatant extraction In some experiments, tumors were dissociated using Miltenyidissociator in culture medium with 1% BSA (1mL for 500mg of tumor). Chemokine production in tumor supernatant was assessed by luminex technology (R&D) on Bio-Plex 200 luminex device (Biorad). Transwell migration assay Migration assays were performed using 24-well transwells with polycarbonate membranes (pore size 5uM). Tumor supernatants were placed in the lower chamber and 5.105 cells extracted from dLN were resuspended in 200μL of RPMI with 1% BSA and placed in the upper chamber. 2h later, migrated cells in the lower chamber were counted using flow cytometry (Accuri C6). qPCR primers sequences Tnf forward, 5’-ACAGAAAGCATGATCCGCG-3’and reverse, 5’-GCCCCCCATCTTTTGGG-3’; Il-6 forward, 5’-CTGCAAGAGACTTCCATCCAGTT-3’and reverse, 5’-GAAGTAGGGAAGGCCGTGG-3’;Il-1βforward, 5’-CGGCACACCCACCCTG-3’ and reverse, 5’-AAACCGCTTTTCCATCTTCTTCT-3’;Ifn-βforward, 5’-atgagtggtggttgcaggc-3’ and reverse, 5’-tgacctttcaaatgca gtagattca-3’; Ifn-α4 forward, 5′-CCTGTGTGATGCAGGAACC-3′ and reverse, 5′-TCACCTCCCAGGCACAGA-3′; L32 forward, 5’-GAAACTGGCGGAAACCCA-3’ and reverse, 5´-GGATCTGGCCCTTGAACCTT-3’.
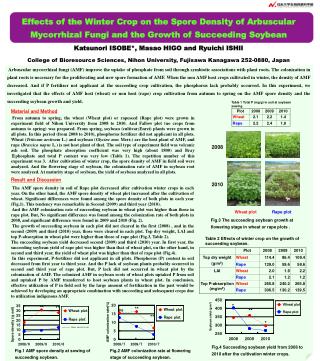
A cDCs Macrophages microglial cells B cells pDCs mTECs mTECs cTECs IFN-γstimulated cells CIITA pI pIII pIV Exons 2-19 pIII+IV-/- mice B B cells (CD11c-PDCA-1-) pDCs (gated CD11cintPDCA-1+) CD4 T cells WT 7.27% 15.08% µMT:WT SSC B220 B220 15.59% µMT pIII+IV-/-:WT CD4 MHCII MHCII Supplemental Figure 1 Chimeric mice selectively lacking MHCII expression on pDCs. (A) In mice, CIITA gene expression is driven by three different cell specific promoters pI, pIII and pIV. pIII+IV-/- mice carry the deletion of promoters pIII and pIV. mTECs: medullarythymic epithelial cell, cTECs: cortical TEC. (B)Irradiated WT mice were reconstituted with BM cells from either µMT mice (µMT:WT) or µMT crossed with pIII+IV-/- mice (µMT pIII+IV-/-:WT).Frequency of CD4+ T cells (left panel) in WT, µMT:WT and µMT pIII+IV-/-:WT mice. Expression of MHCII on B cells (middle panel) and pDCs (right panel) in WT, µMT:WT and µMT pIII+IV-/-:WT mice. Results are representative of at least three experiments.
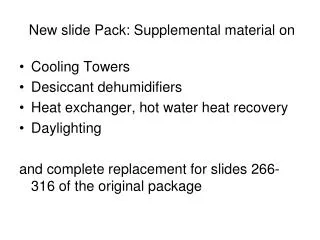
A B µMT pIII+IV-/-:WT µMT:WT 100 dLN dLN 80 18.7% ±1.2 16.1% ±1.9 91.3% ±1.2 83.9% ±1.9 60 % CFSE+ cells 40 20 0 ndLN ndLN 18.3% ±2.4 81.7% ±2.3 20.5% ±0.5 79.5% ±0.5 CD4 100 80 60 % CFSE+ cells 40 CFSE 20 CFSElow CFSEhigh 0 Supplemental Figure 2 Similar T cellproliferation in µMT:WT and µMT pIII+IV-/-:WT chimericmice. µMT:WT and µMT pIII+IV-/-:WT chimeraswereimmunized in the flank (s.c.) withCpG-B and OVAII peptide, and CFSE-labelled OT-II Rag2-/-cellswereadoptivelytransferred 24h later. After 4 days, cellsfromdLNandndLNwereculturedwith OVAIIpeptidefor 18h. (A) Representative flow cytometry profiles showing OT-II Rag2-/- proliferation in dLN and ndLN. (B) Graphs showthemeansand SEM derivedfrom4 miceandarerepresentativeof 3 independentexperiments. μMT:WT μMT pIII+IV-/-:WT
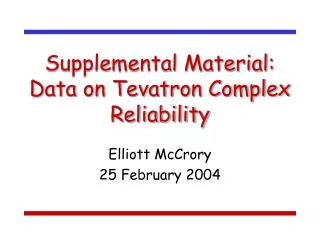
μMT pIII+IV-/-:WT μMT:WT CT CpG-B 50 40 A B 30 20 * 10 pDC CT CpG-B 0 1500 MHCII MFI 1000 500 * CD8+cDC * 0 MHCII MFI 300 200 μMT:WT μMT pIII+IV-/-:WT 100 * Macrophages * 0 MHCII MFI MHCII MHCII Supplemental Figure 3 Selective MHCII abrogation on pDCs in μMT pIII+IV-/-:WT micedoes not affect MHCII expression and upregulation in othercellsubtypes. µMT:WT and µMT pIII+IV-/-:WT chimeraswereimmunized in the flank (s.c.) withCpG-B and cellswereanalyzed in the dLN 15h later(A) Representative flow cytometry profiles of MHCII expression after gating on CD11cintSiglecH+ cells (pDCs), CD11c+ CD8+cDCs (CD8+ DCs) and F4/80+ CD11b+ CD11c- cells (macrophages). (B) Graphs showtheMHCII MFI and SEM derivedfrom 4 miceandarerepresentativeof 3 independentexperiments.
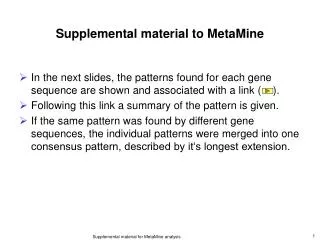
WT WT WT WT WT WT H2-Aα-/- H2-Aα-/- H2-Aα-/- H2-Aα-/- H2-Aα-/- H2-Aα-/- pIII+IV-/- pIII+IV-/- pIII+IV-/- pIII+IV-/- pIII+IV-/- pIII+IV-/- A B 25 2500 20 2000 15 1500 • TnfmRNA Ifn-βmRNA 10 1000 5 500 0 0 80 150 60 100 • Il-6 mRNA 40 Ifn-α4 mRNA 50 20 0 0 150 100 • Il-1βmRNA 50 0 80 60 CpG-B CpG-A CpG-A CpG-B CpG-B Imiquimod Imiquimod Imiquimod CT CT CT CT CT 40 • IFN-α4 mRNA 20 0 CpG-B Imiquimod CT Supplemental Figure 4 MHCII deficientpDCsexhibit normal TLR responsesin vitro. MHCII deficient pDCs produce normal levels of inflammatory cytokines after in vitro TLR stimulation.(A,B) BM-pDCs from WT, H2-Aα-/- and pIII+IV-/- mice were activated or not with TLR ligands. (A) Tnf-α, Il-6, Il-1βand Ifn-α4 mRNA expression were quantified by qPCR after 3h of treatment with Imiquimod or CpG-B.(B) Ifn-β and Ifn-α4mRNA expression after 3h of treatment with CpG-A. (A-B) Results are pooledfrom 4 to 8 mice.
* ** ** VAX A B • µMT:WT 350 µMT pIII+IV-/-:WT 300 250 200 tumor size (mm2) Supplemental Figure 5 Vaccination using OVA protein + CpG-B significantly inhibits tumor growth after Ag presentation by pDCs. (A) µMT:WT and µMT pIII+IV-/-:WT chimeras were immunized s.c. with OVA protein and CpG-B. 7 days later, EG7 cells were implanted s.c. in an ipsilateral manner. Tumor growth was measured every 2-3 days. Results show the mean and SEM derived from 6 miceand are representative of 2 independent experiments. (B) EG7-tumor bearing WT mice were immunized s.c.in a contralateral manner with either OVAII peptide or OVA protein and CpG-B. Tumor growth was measured every 1-2 days. Results show the mean and SEM derived from 6 mice and are representative of 2 independent experiments. 150 100 50 0 4 8 12 16 Time (days) 180 150 CT 120 OVAII + CpG-B OVA Protein + CpG-B 90 60 30 0 5 10 15 20 Time (days)
A B Th0 Th17 IL-17 IFN-γ 15 15 IFN-γ+ CD4+ T cells (%) IL-17+ CD4+ T cells (%) IL-17 10 10 5 5 Th0 Th17 Th0 Th17 IFN-γ 0 0 Supplemental Figure 6 Characterisation of in vitro generated Th0 and Th17 OT-II Tcells. Naive OT-II T cells were differentiated in vitro into Th0 or Th17 cells using α-CD3 + α-CD28 (Th0) in addition with IL-6 and TGF-β (Th17). (A) Representative flow cytometry profiles of IL-17 and IFN-γ expression after gating on CD4+ TCR+ T cells. (B) Percentages of CD4+ T cells expressing IL-17 or IFN-γ. Graphs showthemeansand SEM derivedfrom3 miceandarerepresentativeof 3 independentexperiments.
* 20 15 50 Total cells (nb x103) 40 10 30 A B 5 20 * * NS NS 10 0 0 • CCL-5 (pg/mL) • CXCL-2 (pg/mL) • CXCL-1 (pg/mL) • CCL-2 (pg/mL) 1000 750 500 250 0 800 750 600 Supplemental Figure 7 Impairedcell migration towardtumorsupernatant in micelacking MHCII on pDCs. µMT:WT and µMT pIII+IV-/-:WT chimeraswereimmunizeds.c. with OVAIIpeptideandCpG-B. 7 dayslater, Eg7 cellswereimplanteds.c. in an ipsilateralmanner, andtumorsupernatantwascollected 8 dayslater. (A) WT LN cellswereimplanted in the upperchamber of a transwell and migratedtowardtumorsupernatantformµMT:WT or µMT pIII+IV-/-:WT mice. Graphs shows the number of LN cellscollected in the lowerchamberafter 2h of migration. (B) Chemokinesweremeasuredbymultiplex in thetumorsupernatant. Graphs showtheconcentrationof CCL-2, CCL-5, CXCL-1 and CXCL-2. (A-B) Graphs showthemeansand SEM derivedfrom3 miceandarerepresentativeof 3 independentexperiments. 500 400 250 200 0 0 μMT:WT SN μMT:WT μMT pIII+IV-/-:WT SN μMT pIII+IV-/-:WT
A B CT anti-CD8 CD8 10 CD3 8 6 • CD8+cells(%) Supplemental Figure 8 CD8+ T cell depletion in EG7 bearing mice. EG7 cells were implanted s.c. in WT mice. CD8+ T cells were depleted using anti-CD8 mAbs at day 8, 11 and 14. CD8+ Tcell depletion was analyzed in the blood 3 days after each mAb injection and an example (day 11) is provided. (A) Representative flow cytometry profiles of CD3 and CD8 expression with (anti-CD8) or without (CT) treatment with anti-CD8 mAbs. (B) Graphs show the mean and SEM derived from 3 mice and are representative of 2 independent experiments. 4 2 0 CT • anti-CD8