How to write method and material results statistical findings
510 likes | 751 Vues
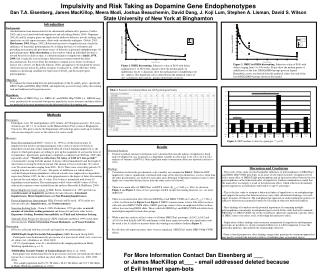
How to write method and material results statistical findings. Dr L. Ghalichi Department of Epidemiology & Biostatistics School of public health Tehran University of Medical Sciences. Method. method. Allows reader to judge the quality of the work Identifies weaknesses

How to write method and material results statistical findings
E N D
Presentation Transcript
How to writemethod and materialresultsstatistical findings Dr L. Ghalichi Department of Epidemiology & Biostatistics School of public health Tehran University of Medical Sciences
method • Allows reader to judge the quality of the work • Identifies weaknesses • Allows repetition of the study • State the study design & specifications
method • WWWWWH (who, what, where, why, when & how?) • Define variables • Patient/Participants inclusion • Dates • Randomisation/Placebo/Blindness • Ethics/consent • Treatments • Outcomes and endpoints • Statistical methods & power
Check-list for Methods • Study design • Clear definition of the participants • Inclusion/exclusion criteria • logical & chronological order • Measurements • Sample size • statistical analyses • New techniques validation Could the reader reproduce your study from the details provided?
Patient / Animals / Specimens • Numbers • How are they grouped • Criteria • Informed consent obtained
Method … • Reason for selecting the design of the study. • Statistical methods used for analysis • If standard techniques is used, give appropriate reference, any modifications should be clearly explained • If new techniques is used, give validity and reliability measures
If applicable … • Ethical approval • Questionnaires • Interventions • Clinical assessments • Proper references
What to include in the methods section • How the study was designed • How the study was carried out • How the participants were recruited and chosen • Give reasons for excluding participants • Consider mentioning ethical features • Give accurate details of materials used • Give exact drug dosages • Give exact form of treatments
In Clinical Trials • Precise details of the interventions intended for each group and how and when they were actually administered. • Clearly defined primary and secondary outcome measures and, • Methods of enhancing the quality of measurements (multiple observations, training of assessors). • interim analyses and stopping rules
In Clinical Trials • Method used to generate the random allocation sequence, including details of any restriction (e.g., blocking, stratification). • Method used to implement the random allocation sequence (e.g., numbered containers or central telephone), • Concealment • Who generated the allocation sequence, • who enrolled participants • who assigned participants to their groups.
blinding • Participants • those administering the interventions • those assessing the outcomes • Those analyzing the findings • If done, how the success of blinding was evaluated.
blinding • Participants • those administering the interventions • those assessing the outcomes • Those analyzing the findings • If done, how the success of blinding was evaluated.
Results Simple complex • Describe the population • Start with positive findings • Establish how comparable your groups were • Use a mixture of text, tables and figures • Mention units of measurement • Mention what numbers, brackets, etc. refer to • Bring the P values
Results Provide only enough interpretation to lead the reader from one experiment to the other • Avoid lengthy analysis and comparison to the work of others • No need to follow chronology of study • Rather, provide a logical progression and tell a story
Results • Start with positive findings. • Do not compare the present data with previously published results. • Write the text of the Results section concisely and objectively. • The passive voice will likely dominate here, but use the active voice as much as possible
Tables and Figures • Consider using a table to present large amounts of data/results. • Must refer to all tables in text. • Use figures to graphically represent significant results.
Results • Use the “Stand alone” tables • Make sure totals add to 100% • Do not repeat the Tables and Figures in text • Summarize: e.g., there were no significant associations… • Describe: e.g. there was a three fold increase in the risk of ..
Tables and Figures • Each Table or Figure must include a brief description of the results being presented and other necessary information in a legend. • Table legends go above the Table; tables are read from top to bottom. • Figure legends go below the figure; figures are usually viewed from bottom to top
Tables and Figures • Tables and Figures are assigned numbers separately and in the sequence that you will refer to them from the text. • The first Table you refer to is Table 1, the next Table 2 and so forth. • Similarly, the first Figure is Figure 1, the next Figure 2, etc.
Tables and Figures • When referring to a table from the text, "Figure" is abbreviated as Fig.,e.g., Fig. 1. • Table is never abbreviated, e.g., Table 1.
Example 1: Courtesy of Shelley Ball. Example 2: Courtesy of Shelley Ball.
Figures • Used when we want to distinguish a result & make it prominent into readers view • Figures are visual presentations of results, including graphs, diagrams, photos, drawings, schematics, maps, etc. • Graphs are the most common type of figure. • Graphs show trends or patterns of relationship.
Figures • Avoid clutter(too many numbers &symbols) • Should provide a clear statistical message • Vertical (“Y”) axis: outcome/dependent variable • Horizontal (“X”) axis: exposure/independent variable • Name & define each axis • Give the measurement unit of each axis
Common mistakes Raw data Redundancy Discussion and interpretation of data No figures or tables Methods/materials reported
Figure 1. Effect of total alkaloid fraction of methanolic extract on mean survival time
Figure 1. Effect of total alkaloid fraction of methanolic extract of unripe fruit of Solanum pseudocapsicum on mean survival time (MST) in tumor bearing mice.
Something to avoid ! • Do not present the same data in both a Table and Figure - this is considered redundant and a waste of space and energy. • Decide which format best shows the result and go through it. • Do not report raw data values when they can be summarized as means, percents, etc.
DoNOT! • Use big words that you do not really mean • Attributable • Causality • Preferential • Significant (without statistical evidence) • Validity • Mix incidence and prevalence • Mix frequency, rate, proportion, ratio
Statistical findings • For each primary and secondary outcome, a summary of results for each group, and the estimated effect size and its precision (e.g., 95% confidence interval). • Address multiplicity by reporting any other analyses performed, including subgroup analyses and adjusted analyses, indicating those prespecified and those exploratory
گزارش نتايج آماري • نوشتن تعداد فراواني همراه با درصدها وقتي تعداد نمونه اندك است. • عدم نياز به نوشتن فرمولهای حجم نمونه و آزمونهای آماری • ارائه پارامترهايیكه آزمون شدهاند مانند ميانگين, نسبت يا درصد, ضريب همبستگي, حتي اگر آزمونها معنيدار نشده باشند. • نوشتن شاخص آزمون و مقدار آن همراه با درجه آزادي وp-value • نوشتن مقداردقيق p-value براي آزمونهاي معنيدار وغيرمعنيدار(تا دو رقم اعشار)
گزارش نتايجآماري • تعريف كردن علائمي كه براي نتايج معنيداربهكار ميرود(مانند ستاره) و بهكار بردن علائم مشابه • نوشتن اعداد بهصورت گرد شده با درنظرگرفتن دقت دادههاي اوليه (ميانگين تا يك رقم اعشار و انحراف معيار و خطاي معيار تا دو رقم اعشار بيشتر از دادههاي خام) • درج درصدها تا يك رقم اعشار (گاهي حتي نياز به ارقام اعشاري هم نيست). • نوشتن شاخصهايي مانند t ,r تا دو رقم اعشار
p-value Could the result have occurred by chance? The result is unlikelyto be due to chance The result is likelyto be due to chance 0 1 p < 0.05 a statistically significant result p > 0.05 not a statistically significant result p = 0.05 or 1 in 20 result fairly unlikely to be due to chance p = 0.5 or 1 in 2 result quite likely to be due to chance 1 20 1 2
Confidence Interval (CI) Is the range within which the true size of effect (never exactly known) lies, with a given degree of assurance (usually 95%)
Check list for Results • Baseline data provided? • Primary and other endpoints clear and complete? • Does the text complement figures and tables? • Are measures of uncertainty mentioned?
In Results • Tell a story • Use the most logical sequence to present the data (not necessarily the order in which you did the experiments) • Just report the data - do not include interpretation or comparison to literature • No duplication of data
Guidelines for Writing Results • Specify the dates of the study • Provide a schematic summary • Describe the characteristics of each group • Indicate if the sample is representative • Indicate if randomization was successful • Describe duration and nature of follow up
The Study Outcomes • Present the results for all primary endpoints • Report statistical findings in detail • Report actual p values , 95% CI , etc. • Report the main findings in figures or tables, you don’t need to also report them in the text • Report confounders
A Few Rules • The first time you use an abbreviation, define it • When you give the commercial source for a reagent, the first time you cite the source include the location of the company (city and state) • Make sure the subject and verb agree in every sentence • No exclamation points!
A Few Rules - continued • Look for redundancy within the manuscript • Try not to use “it” or “they” - be specific! • No jargon • Two shorter sentences are frequently much more effective than a long, complex sentence • “Data” is plural not singular, i.e., “the data are…” NOT “ the data is…”
A Few Rules - continued • Capitalize people’s names • Never, ever plagiarize! (even from yourself!) • Use numbers when expressing measurements, except when the number would begin a sentence
In Clinical Trials: Participant flow • Flow of participants through each stage (a diagram is strongly recommended).Specifically, for each group report the numbers of participants randomlyassigned, receiving intended treatment, completing the study protocol, andanalyzed for the primary outcome. Describe protocol deviations from study asplanned, together with reasons.
Remember … • Number of participants (denominator) in each group included in each analysis and whether the analysis was by “intention-to-treat.” • State the results in absolute numbers when feasible (eg, 10/20, not 50%). • All important adverse events or side effects in each intervention group.