Dependency Ratios
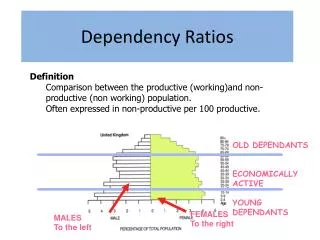
FEMALES To the right. MALES To the left. Definition Comparison between the productive (working)and non-productive (non working) population. Often expressed in non-productive per 100 productive. Dependency Ratios. OLD DEPENDANTS ECONOMICALLY ACTIVE YOUNG DEPENDANTS.

Dependency Ratios
E N D
Presentation Transcript
FEMALES To the right MALES To the left • Definition • Comparison between the productive (working)and non-productive (non working) population. • Often expressed in non-productive per 100 productive. Dependency Ratios OLD DEPENDANTS ECONOMICALLY ACTIVE YOUNG DEPENDANTS
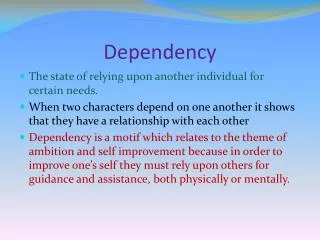
Non-productive population: • Refers to the very old (usually >65 years of age) and the very young (usually <15). • Considered to be the “non-productive” segments of society because they are not part of the labour force.
Productive population: • Those between 15 and 65 years of age. • This portion of the population constitutes the labour force. • However, it has now been revised to consider lower than 20 years in developed countries (increasing time spent for education).
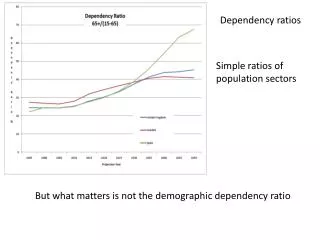
How is it Calculated? Ratio of the dependent population (aged 0 to 14 years and 65 years and over) to that of the non-dependent population (working age - 15 to 64 years). 0-14yrs (children) + 65+yrs (Elderly) 15-64yrs (Those of working age) Worked example: UK 2001 (figures in millions) 11.105 + 9.341 38.342 X100 This means that for every 100 people of working age, there were 53.33 people dependent upon them. 53.33 X100
How population pyramids change with development Progressive pyramid – Expanding population Youthful population Ageing population Regressive Pyramid
Your task: This is a timed task. You have 45 minutes to put together a Powerpoint Presentation relating to the problems a high dependency ratio can cause. The groups are as follows: Group 1: Too many under 15s (Alex, Ashna & Beam) Group 2: Too few under 15s (Zain, Mot and WenPor) Group 3: Too many over 65 (Josh, Dimitri and One) Group 4: Too many over 65 (Nicole & Beam) Group 5: Too many under 15 (Sunny and Busara)
Resources • Each group will be allocated 2 lap tops • You should use Waugh (pages 12 or 14) depending on which presentation you are doing. • You should also include pictures, a population pyramid and some research using the internet. • Divide the work equally and be productive.
Structure • The first slide should state what you are studying / presenting e.g. ‘Too few under 15’ • Second slide should show a calculation for the dependency ratio of a country with these problems (e.g. Italy for Ageing population i.e. Too many over 65). You should also include a labelled population pyramid which shows the problems (http://www.census.gov/ipc/www/idb/pyramids.html) • The next two or three slides should focus on the problems. • The last slide should focus on the possible solutions to these problems.
Presentation • Once you have finished your presentation, you need to save it to your thumb drive and place on my desk top (Year 10 presentations). • I will then pick a group from each category to present their findings to the rest of the groups-So be ready to present and all group members MUST speak • After the holidays, I will print the slides so that everyone has a copy of each others work. Good luck!