Download
1 / 22
220 likes | 355 Vues
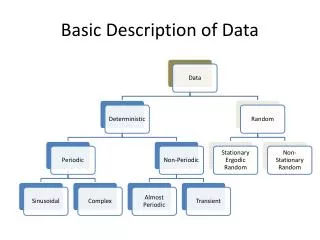
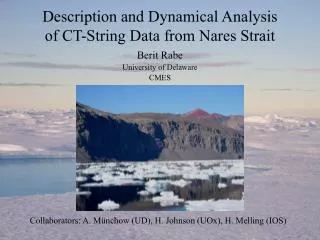
Description and Dynamical Analysis of CT-String Data from Nares Strait. Berit Rabe University of Delaware CMES. Collaborators: A. Münchow (UD), H. Johnson (UOx), H. Melling (IOS). Study Area. Arctic Ocean. Nares Strait.

E N D
Description and Dynamical Analysisof CT-String Data from Nares Strait Berit Rabe University of Delaware CMES Collaborators: A. Münchow (UD), H. Johnson (UOx), H. Melling (IOS)
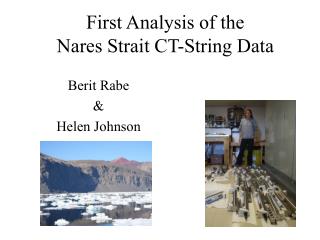
Study Area Arctic Ocean Nares Strait Moorings: all recovered instruments have a complete three-year record from Aug 2003 - Aug 2006
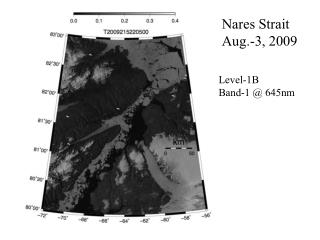
Motivation • ASOF’s aim (Arctic Sub-Arctic Ocean Fluxes Study): • Measure and model variability of fluxes between the Arctic and Atlantic Oceans with the view to implement a longer-term system of critical measurements needed to understand the high-latitude ocean's steering role in decadal climate variability. • A simulated increase in either of the main freshwater outputs that connect the Arctic Ocean with the Atlantic (via the Canadian Arctic Archipelago and along the East Greenland Shelf) seems capable of effecting a slowdown of the MOC. • The Polar and Sub-Polar shelf seas are an important component of the global climate system. They support the fluxes of large volumes of both solid and liquid freshwater. • Gain an understanding of the freshwater flux through the North American Arctic which is presently inadequate to permit predictions of its sensitivity to climate change. MODIS image of Nares Strait on August 12th, 2005. Dot indicates the location of the mooring line. http://asof.npolar.no
The CT-Data Set • 6 out of 8 CT-moorings recovered (each with 4 SBE37) • Three-year record, sampling rate: 15 minutes • Depth of CT-instruments: 30m (P), 80m, 130m, 200m (P) • Innovative mooring design: flexible strings made for sliding under ice, profiling the whole water column • P value assignment to every C and T value through linear interpolation for 80m and 130m instrument (justification: mooring model) • Evaluation of linear behavior with P sensor at 80m shows good results CT-moorings with 4 SBE37 x x x Canada Greenland
event Salinity Signal Top instrument on Canadian side Salinity data without mooring motion 10-day low-pass filtered salinity data • Processing of salinity data: • Remove the part of the salinity signal that is correlated with the mooring motion (assumption: linear system) • Low-pass filter uncorrelated salinity signal
942-944 Event in salinity signal Across-channel salinity from top instrument Two-day low-pass filtered Greenland 1PSU Canada • Fresh water in top layers on Canadian side • Sloping isohalines in the middle of the strait Thermal wind balance ∂ug /∂z: geostrophic shear of along-channel velocity ∂/∂y: cross-channel density gradient (from CT data)
. . x x Geostrophic velocities at days 942 - 944 cm/s Reference speed u0 from ADCP data at 210 m Canada Greenland • Volume Flux • Integration of geostrophic velocity across the section • About 1 Sv (106 m3/s) during strong event to the South
Conclusions • Unique three-year gap-free data set at high resolution (spatial and temporal) in Nares Strait • Innovative mooring design for an ice-covered area and sampling the whole water column • Focus on extreme salinity event at year day 940 • Geostrophic velocities show two-way flow: to the South especially in upper layers on Canadian side, to the North on Greenland side • Volume flux of about 1 Sverdrup to the South during event
Outlook • Calculate geostrophic velocities and volume fluxes for whole record • Calculate freshwater fluxes for Nares Strait (difficulty: most freshwater in top 30m where no measurements exist) • Compare data to volume fluxes from ADCP data • Evaluate momentum balance and forcing mechanisms • Combine this data set with wind, pressure sensor and ice thickness data to improve understanding of the dynamics
input output pressure(f) H(f) salinity(f) + (f) noise Salinity Signal Assume a linear system transfer function S(f) = H(f)*p(f) + (f) correlated part uncorrelated part (f) = S(f) - H(f)*p(f) Use time series analysis tools to calculate cross correlation, coherence squared
Mooring motion due to tides Mode 1 [dbar] depth across-channel • EOF Analysis of three-year pressure record • Mean removed, most variance in first mode (71%) • Array moves back and forth simultaneously • Semi-diurnal tide strongest constituent
210 dbar • Mooring Design • Depth of CT-instruments: 30 m, 80 m, 130 m, 200 m • Pressure (P) sensors at 30 m and 200 m instrument • P value assignment to every T and C value through linear interpolation for 80 m and 130 m instrument • Justification: mooring model
P2 P3 200m-80m =120m Pressure calculation P1 cos() = (P4 - P1)/170 cos() = (P4 - P2)/120 200m-30m =170m solve for P2 P2 = (P4 - (120*cos())) P4 Same for P3 P3 = (P4 - (70*cos()))
938 944 946 940 • Salinity sections for 2-day means • Fresh water in top layers on Ellesmere Island side • Sloping isohalines in the middle of the strait 942
0.2 Temperature [ºC] Variation in Water Masses TS Diagram Greenland TS Diagram Ellesmere Island 0.2 Temperature [ºC] -1.4 -1.4 30 Salinity [PSU] 35 30 Salinity [PSU] 35 Top layer Second from top Third layer Fourth layer CTD data 2003 • August 6th - August 12th 2003 • Profiling covers all water masses (comparison to CTD data) • Warm, salty water on Greenland side • Cold water on Ellesmere Island side
Salinity Variations across the strait Sections mode 1 and 2 [PSU] depth across-channel • EOF Analysis of three-year salinity record • Mean removed, most variance in first two modes • Highest variability in S in top layers on Ellesmere Island side in Mode 1 • Mode 2 shows sign change across the strait Mode 1: 46% Mode 2: 19% Mean S
Mean P section EOF Analysis on Pressure Data Mode 1: 71% Mode 1+2: 83% Sections mode 1 and 2 [dbar] depth across-channel Amplitude patterns mode 1 and 2 amplitude time • Mean removed, most variance in first two modes • Array moves back and forth simultaneously
Pressure Data Evaluation • KS03: additional pressure sensor at 80 dbar • Original justification: mooring model • Test linear relationship through intercomparison of calculated and measured P data at • 80 m
Sections across Nares Strait • + mark mean instrument positions, mean data of whole three-year record • Warm salty water on Greenland side • Cold fresh water in top layers on Ellesmere Island side • Sloping of isopycnals
Current data at KS02 (Ellesmere Island side) N component bin depth Velocity [cm/s] u/t=1.8x10-6 m/s2 time [days since 01/01/2003] • Momentum balance • f*v = 1.44*10-4 1/s * 0.01m/s = 1.44*10-6 m/s2 same O magnitude? • Along-channel pressure gradient ~10 cm
6 1.1 1.0 0.9 0.8 0.7 0.6 0.5 [Münchow, JMR 2008] Integration of geostrophic velocity across the section About 1 Sv (106 m3/s) during strong event Volume Flux