Download
1 / 41
410 likes | 714 Vues
Opening your Mind to Vibrational Spectroscopy. Rodolfo J. Romañach, Ph.D. UPR-Mayagüez rromanac@yahoo.com May 14, 2012. Regions of Infrared Spectrum: Far Infrared: 650 – 25 c m -1 Mid Infrared: 4000 – 650 c m -1 wavelengths from 2.5 m to 25 m).

E N D
Opening your Mind to Vibrational Spectroscopy Rodolfo J. Romañach, Ph.D. UPR-Mayagüez rromanac@yahoo.com May 14, 2012
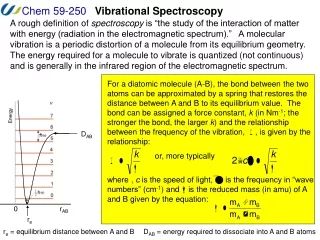
Regions of Infrared Spectrum: Far Infrared: 650 – 25 cm-1 Mid Infrared: 4000 – 650 cm-1 wavelengths from 2.5 m to 25 m). Near Infrared: 12800 – 4000 cm-1(0.8 - 2.5 m, or 800- 2500 nm). Absorption occurs when the dipole moment of the molecule changes, and the molecule interacts with radiation equal to the frequency of vibration. Infrared (Vibrational) Spectroscopy
- + - + - + Change in Dipole Moment during Molecular Vibrations • Must change for IR absorption to occur. • The dipole moment is a measure of the degree of polarity of molecule (magnitude of the separated charges times the distance between them). • A measurement of degree of unequal distribution of charges in molecule. H Cl
Band Intensity in IR • Band intensity depends on the rate of change of dipole moment during absorption of IR light. • Stronger bands occur when the change in dipole moment is greatest.
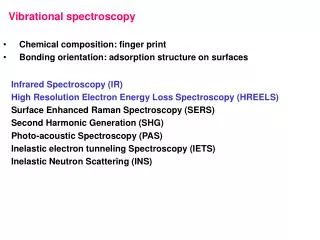
Infrared Spectroscopy (mid-IR) & Near Infrared Spectroscopy • Infrared Spectroscopy (mid-IR), studied in organic chemistry courses; principal identification method in pharmaceutical industry. • Mid-IR sharp bands that provide structural information on compounds; better than fingerprint. • Near IR weak overlapping bands; difficult to interpret (region of 12500 to 4000 cm-1, wavelengths from 0.8 to 2.5 m.)
Mid-IR Spectroscopy Widely Used in: • Identification of Pharmaceutical Raw Materials and Finished Products. Principal method of material identification in a pharmaceutical manufacturing company. • Combination with MS and NMR to determine structure of process impurities and degradation products. • Characterization of natural products, use of GC/FT-IR. • Forensic Analysis, IR-Microscopy. • Environmental Analysis: GC/FT-IR. • Surface Analysis, Diffuse Reflectance, Attenuated Total Reflectance, Grazing Angle. • Studies of Protein Structure and Dynamics.
Group Frequencies • Characteristic of functional groups such as -O-H, -CH3, -COCH3, and COOH. • Determined empirically by studying the spectra of many related molecules. • Always found in the spectrum of a molecule containing that group, and always occurs in the same narrow frequency range. • The form of the bands is nearly always the same in every molecule containing that group.
Dividing Line • 1500 cm-1 dividing line: above 1500 cm-1 if a band has a reasonable intensity, it is a group frequency. • Below 1500 cm-1 the band may be either a group or fingerprint frequency. • Below 1500 cm-1 called the fingerprint region.
Typical Identification in Pharmaceutical Industry with Mid-Infrared Spectroscopy
Mid-IR Spectroscopy + Each compound has a unique mid-IR spectrum. Excellent for identification. Key technique for identifying raw materials in pharmaceutical industry. + Information rich technique, spectra can be interpreted – learning that you have an organic compound, carbonyls, aromatic compounds, etc. - Requires sample preparation, except when attenuated total reflectance is used.
Can your HPLC analyze & identify this sample in 1 minute? Sample from Dr. Lysa Chismadia’s collection, RUM Geology Department.
Advantages of NIRS • Sample preparation is not required leading to significant reductions in analysis time. Waste and reagents are minimized (non-destructive testing). • Excellent analytical method for the study of solids. Capable of ID based on both chemical & physical properties. • Spectra may be obtained in non-invasive manner. • Remote sampling is possible (good for hazardous materials). NIR radiation can be transmitted through silica fiber optics that are relatively inexpensive. Spectroscopy of solids non-invasive spectral acquisition & remote sampling
Non-invasive monitoring. Opportunity for following processes. CDI Lab Scale NIRS system, www.controldevelopment.com
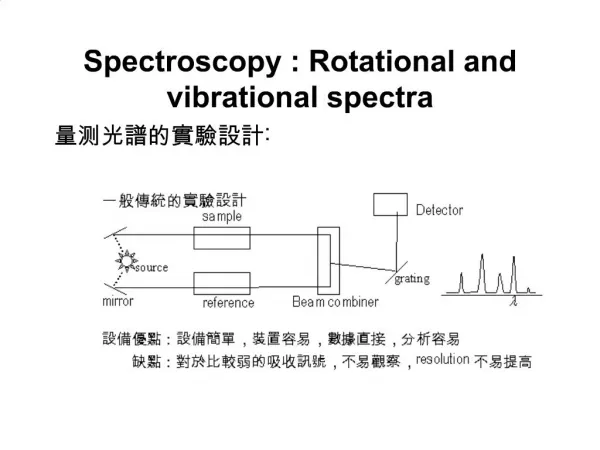
IR Source Sample IR Energy Delivery Fiber Bundle Collection Fiber Bundle Reflected IR Energy Detector Powder and Solids Probe – Courtesy Bruker Optics Diffuse Reflection Probe Schematic Powder & Solids Probe with liquid attachment Extra-long immersion depth: 12”
Spectroscopy of the Solid State • Spectroscopy - Interaction between radiation and matter. • Spectra – pattern that indicates absorbance or reflection of radiation as a f(λ) or f(ν). • NIR – offers possibility of study of interaction of solids with radiation since sample preparation is not required. Need to visualize interaction between particle and radiation. May also be used for liquids, but majority of applications for solids avoiding sample preparation.
Characterized by Wide Bands Wide bands - 12,000 – 4,000 cm-1, or 800 – 2500 nm Overtones & Combination Bands of O-H, N-H and C-H groups
NIR Fundamentals: Electromagnetic Spectrum 12,500 cm-1 (800 nm) 4,000 cm -1 (2500 nm) Frequency (cm-1) -Ray X – Ray Ultraviolet visible NIR MIR FIR ESR NMR Region Infrared Microwave Radio, TV Waves NuclearTransitions InnerShell Electronic Transitions ValanceElectron Transitions MolecularVibrations MolecularRotations SpinOrientation in MagneticField Interaction Wavelength (m) Courtesy Bruker Optics
Advantages of NIRS • Possibility of using it in a wide range of applications (physical and chemical), and viewing relationships difficult to observe by other means. • The spectrum may be used to identify the formulation and also to quantify the drug in the formulation.* Cross-sensitivity. *M. Blanco, J. Coello, A. Eustaquio, H Iturriaga, and S. Maspoch, Development and Validation of a Method for the Analysis of a Pharmaceutical Preparation by Near-Infrared Diffuse Reflectance Spectroscopy, Journal of Pharmaceutical Sciences, 1999, 88(5), 551 – 556.
Cautions in Working with NIRS • Overlapping bands, not easy to interpret. Differences in spectra are often very subtle. • May confuse chemical & physical effects. • Calibration requires careful experimental design. • Depends on accuracy of reference methods. • Usually not for trace level analysis. • Implementation of NIR requires a significant investment in Human Resources. Not an HPLC !! Over 60% of instruments installed in pharmaceutical companies are never used.
NIR Absorption Bands • Absorption bands in the NIR are the result of combination and overtone bands from the fundamental vibrations of C-H, N-H, and O-H bonds seen in the mid-IR. • The overtone and combination bands are 10 – 100 X less intense than the fundamental bands in mid-IR. (Do not confuse energy of vibration with intensity of band). • Differences in spectra are usually very subtle. Instruments have a high signal to noise ratio.
Oleic Acid MIR Absorbance NIR Wavenumber cm-1 MIR vs. NIR: Oleic Acid NIR Bands will be 10 – 100 x weaker than mid-infrared bands Slide Courtesy Bruker Optics
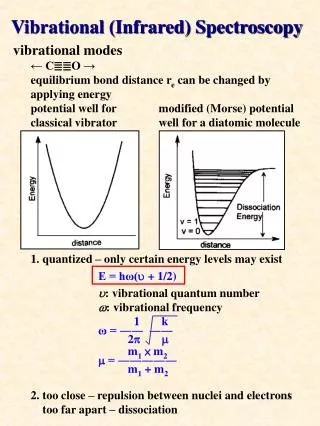
Fundamentals and Overtones In the case of the anharmonic oscillator, the vibrational transitions no longer only obey the selection rule n = 1. This type of vibrational transition is called fundamental vibration. Vibrational transitions with n = 2, 3, ... are also possible, and are termed overtones. Called first, second, and so on, overtones.
Subtle Differences,Valuable Info. M. Blanco, D. Valdés, I. Llorente, and M. Bayod, “Application of NIR Spectroscopy in Polymorphic Analysis: Study of Pseudo-Polymorphs Stability”, Journal of Pharmaceutical Sciences, 2005, 94(6), 1336 – 1342.
Summary • NIR spectra are difficult to interpret and differences in spectra are very subtle, yet it is able to discriminate between spectra of very similar molecules (although the differences are not as easy to discern as in mid-IR). • Able to provide both chemical and physical information on a samples in the solid state. • Must work cautiously to avoid confusing chemical and physical information.
Developing a Calibration Model • Most NIR calibration models are multivariate. The absorbance at multiple wavelengths or frequencies are mathematically related to an analyte concentration or physical property. • Multivariate regression models like MLR, PLS are used, unlike the univariate linear least squares method used in most analytical chemistry.
O-H first overtone Variation Implies Information !! However, variation could come from differences in moisture content (chemical info) or variation in particle size, porosity, density (physical info). Absorbance, 1st-derivative, and 2nd derivative spectra. X. Zhou, P. Hines, and M.W. Borer, “Moisture Determination in a Hygroscopic drug Substance by Near Infrared Spectroscopy”, Journal of Pharmaceutical and Biomedical Analysis, 17(1998), 219-225.
O-H combination band X. Zhou, P. Hines, and M.W. Borer, “Moisture Determination in a Hygroscopic drug Substance by Near Infrared Spectroscopy”, Journal of Pharmaceutical and Biomedical Analysis, 17(1998), 219-225. Absorbance, 1st-derivative, & 2nd derivative spectra.
Developing a Chemical Quantitative Method • Used Partial Least Squares (PLS) regression to relate changes in water content to changes in the NIR spectra. • PLS is an example of a multivariate method that uses many responses from the spectrum and relates them to an analytical property.1 • NIR spectra will include variation due to particle size and other physical effects. If you want to measure a chemical property such as concentration then you need to make sure that you are not confusing physical effects with chemical changes. – reason for pretreatment. 1- the methods that we study in analytical chem. class are still univariate)
Developing a Chemical Quantitative Method • Differences in particle size lead to differences in baseline. • Baseline is not related to concentration. • May eliminate baseline with 1st or 2nd derivative. • The changes observed are more related to chemical changes after the spectral pretreatment.
Raw spectra (1100-2205nm) obtained from ribbons of MCC 200 produced at 15 (straight), 25 (dash), and 45 bars (dot). Spectra subtracted to zero at one λ (baseline corrected). However, keep effect of pressure on spectrum to develop a NIR model for density. D, Acevedo, A. Muliadi ,A. Giridhar, J.D. Litster, R. J. Romañach, AAPSPharmscitech, 2012, 13(3), 1005 – 1012, DOI: 10.1208/s12249-012-9825-0.
Comparison of Sampling Volume Systematic error in the relationship between the optical (NIR) method and the reference method. First 2 mm sampled by NIR beam vs. Entire Sampled Analyzed by HPLC or UV method
Calibration with Error Three types of error: • Random error in the reference laboratory values • Random error in the optical data • Systematic error in the relationship between these two. (e.g. Differences in the sample size of the two methods – sampling error) From: Principles and Practice of Spectroscopic Calibration – H. Mark, John Wiley & Sons, 1991, p. 17
The NIR radiation interacts with about 260 mg of sample, the acquisition time is about 0.5 seconds, RMSEP ≈ 0.34 % (w/w). A.U. Vanarase, M. Alcalà, J.I. Jerez Rozo, F.J. Muzzio and R.J. Romañach, “Real-time monitoring of drug concentration in a continuous powder mixing process using NIR spectroscopy, Chemical Engineering Science, 2010, 65(21), 5728 – 5733.