Download
1 / 70
700 likes | 804 Vues
Lower Lakes and Murray River Modelling Virtual Weir Investigations. Canberra 31 August 2009. To be Discussed (outline):. Project Background and Outline Data Availability Model Calibration Wind, Water Level, and Wind Setup Analysis Model Design “What if” Simulations

E N D
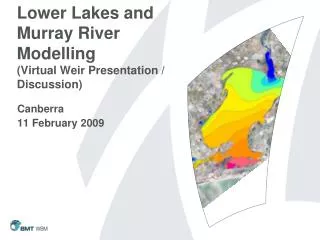
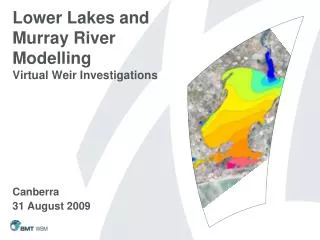
Lower Lakes and Murray River ModellingVirtual Weir Investigations Canberra 31 August 2009
To be Discussed (outline): • Project Background and Outline • Data Availability • Model Calibration • Wind, Water Level, and Wind Setup Analysis • Model Design “What if” Simulations • Model Mitigation Simulations • Model “Worst Case” Simulations • Extended Model Validation • Suggested Future Model Simulations and Studies
Data Availability Several new DWLBC anemometers in Lake & River > 18 months DWLBC gauges (Level, EC Temp) Lock 1, SA Water Off-takes, Irrigation, Lake Albert Pumping NRM Board Met Station Data BOM SILO Evaporation Data Long-wave Radiation Data from BMT-ARGOSS weather model Approx. Weekly AWQC CTD Long-Section Vertical Profiles High Resolution AWQC EC and Temp Data DWLBC Whole of Lake Salinity Survey CSIRO integrated bathymetry (10m DEM)
Model Selection & Enhancements Adoption of TUFLOW-FV for 2D Model Developed by BMT-WBM over past 3 years Significantly reduced run times due to multi-threading Improved spatial and temporal resolution Improved wetting and drying Sharper salinity gradients (less numerical diffusion) Improvements to ELCOM (3D) Model Reduced grid size (50 to 25m) Increase from 22 (1m) to 45 (0.5m) vertical layers Spatially varying wind / met fields (3) Reduced time-step (90 – 60s)
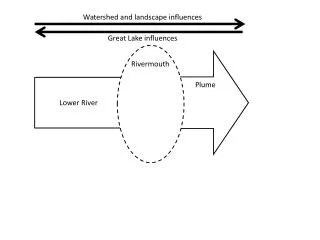
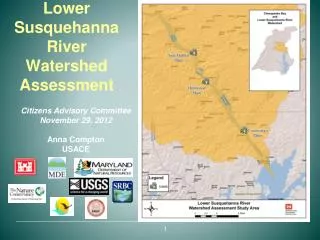
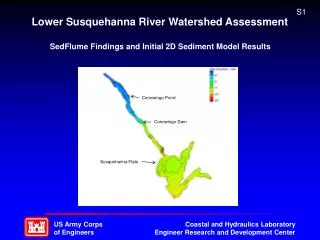
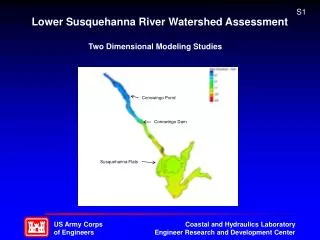
Model Setup/Extents • TUFLOW-FV 2D (Blue) : All areas upstream of Tidal Barrages & Downstream of Lock 1, Lake Albert disconnected • ELCOM 3D (Green) : From Pomanda Island (upstream of weir location) to Murray Bridge • TUFLOW-FV simulation executed first, then results fed to ELCOM (U/S & D/S Boundaries)
Model Extents and Boundaries (2D) TUFLOW-FV (2D) Model Extents and BC’s
Model Extents and Boundaries (3D) ELCOM (3D) Model Extents and BC’s
2D Model Calibration Short-term Calibration 26/3/2009 – 1/6/2009 Long-term Calibration 17 months Jan 2008 – June 2009 Calibration Objectives: Replicate long-term water level changes Replicate observed wind setup (short-term) Replicate observed salinity changes
Modelled (2D) Long-term Water Levels Measured and Modelled Water Levels (10 Day Average) Beacon 90
Modelled (2D) Short-term Water Levels Measured and Modelled Water Levels Wellington Ferry
Modelled (2D) River & Lake Salinity Measured and Modelled Salinity at Pompoota
Modelled (2D) River & Lake Salinity Measured and Modelled Salinity at Mulgundawa
Modelled (3D) Pomanda Salinity Measured and Modelled Salinity In Pomanda Embayment
Modelled (3D) Pomanda Temperature Measured and Modelled Temperature In Pomanda Embayment
Modelled (3D) Wellington Salinity Measured and Modelled Salinity at Wellington
Modelled (3D) Wellington Temperature Measured and Modelled Temperature at Wellington
Modelled (3D) Salinity Profile 1st May Measured Modelled
Modelled (3D) Salinity Profile 8th May Measured Modelled
Modelled (3D) Salinity Profile 21st May Measured Modelled
Status of Calibration Model is considered to be well calibrated and closely matches both the formation and decay of the salt-wedge. Known model limitations: No benthic temperature boundary Suspended sediment not modelled Single wind-field in TUFLOW-FV Single d/s boundary link between 2D and 3D Quantification of groundwater influence No spatial variability of irrigation extraction Goolwa Barrage salt flux not quantified Models were reviewed by Ian King (author of RMA Model Suite) who concluded “Overall the calibration is impressive ..”
Wind, Water Level, and Wind Setup Analysis To be finalised early September………
Model Design “What if” Simulations A broad range of model Design (ie not actual observed events) simulations were undertaken to help better understand the impacts on hydrodynamics and water quality under a range different conditions. “What if”: Lock 1 flows were higher or lower Lake water levels were lower or higher Winds were stronger or lighter Lake salinity was higher The sill in Pomanda Embayment was scoured A backflow event occurred in summer or spring Two events occurred in close succession There was reduced mixing after a backflow event
Model Design “Flow” Simulations The model results indicate the following: More salt would have been able to backflow and travel upstream as a gravity density current if Lock 1 discharges were any lower than recorded; A 50% increase to flows at Lock 1 could have completely prevented salt from reaching Tailem Bend during the ANZAC weekend backflow event; An increased flow of just 25% would have greatly reduced the persistence and concentration of salt on the bed at Tailem Bend; Gauging data shows a significant drop in Lock 1 discharge (of approximately 25%) during the start of April 2009. Model results suggest that if this decrease had not occurred, the formation of a salt wedge at Tailem Bend may have been largely prevented; and Seasonal variation of Lock 1 discharges can influence the formation of a salt wedge during significant back-flow events and as such should be considered as part of the Lakes’ operation.
Model Design “Water Level” Simulations The model results indicate the following: The amount of salt transported upstream is highly sensitive to Lake water level; Lowering water levels would increase the severity of backflow events based on conditions that caused the ANZAC day event. A water level of -1.5 m AHD would increase the concentration and volume of the salt wedge that is transported upstream; Lower water level conditions of -2.0 m AHD would be influenced by a sill separating the River from the Lake in Pomanda Embayment reducing the severity of backflow events. Need to consider the stability of the sill. At higher water levels above 0 m AHD, the likelihood and severity of a backflow event may actually be increased (especially at higher Lake salinities). Even though the magnitude of wind setup is lower at higher Lake Levels, the position of the freshwater interface will move further upstream as the volume of water and mixing of salinity within Pomanda Embayment increases.
Model Design “Wind Speed” Simulations The model results indicate the following: The TUFLOW-FV and ELCOM models are sensitive to the applied wind fields and high quality wind data is required to accurately replicate observed hydrodynamics and salt transport; Lower wind speeds (by as much as 10%) would have resulted in greatly reduced volumes of salt transported upstream into the River during the backflow event; Higher wind speeds (by as much as 25%) would have additionally resulted in the formation of a salt-wedge at Wellington on the 2nd and 15th of April; Destratification of the salt wedge is strongly influenced by the magnitude of the smaller day-to-day seiches that occur in the River; Shear stress mixing from the seiche energy that originates in the Lake due to wind setup plays an important role in destratification of the salt wedge at Wellington and Tailem Bend; and While higher wind speeds result in more salt being delivered upstream to the River, the higher wind speeds can also assist with a more rapid dissipation of the salt-wedge through shear stress mixing following the formation of a salt wedge.
Model Design “Lake Salinity” Simulations The model results indicate the following: An increase in Lake salinity (to ~8000 EC) would result in significantly higher levels of salt near the bed at Wellington and Tailem Bend; Dissipation of the salt wedge by shear dispersion and penetrative convection still occurs at higher salinities; Under marine lake salinity conditions, but adopting all of the other ANZAC forcing data, the salinity of surface waters at Tailem Bend is predicted to always less than 1600 EC and while it would occasionally rise above 1400 EC the peaks are predicted to be shorter than 4 days; Cumulative impacts, such as multiple backflow events occurring consecutively, cannot be directly superimposed; and There is some potential for increased salinity to occur near the surface during a second backflow event due to dissipation of the remnant salt wedge that may have formed during the initial backflow event, however, the second event appears to result in the removal of much of the salt from the first event.
Model Design “Sill Scour” Simulations The model results indicate the following: A scoured channel may reduce the severity of backflow events for ANZAC day conditions, due to increased flow exchange between the Lake and River; The amount of scour within the embayment area was shown to influence the volume of salt pushed upstream and the rate of destratification following a backflow event. Increased channel scour does not necessarily result in a greater volume and concentration of salt transported into the River than under the base-case condition; Decreased water level combined with increased channel scour does not significantly increase the risk of saline intrusion; and The increased flow exchange between the Lake and River due to a scoured channel may assist in the dissipation of any salt-wedges that do form in the deeper pools within the River.
Model Design “Heat ‘n’ Mix” Simulations The model results indicate the following: Penetrative convection is shown to contribute to the breakdown of the salt wedge, which is greatly influenced by meteorological conditions including air temperature and solar radiation; During spring and summer (warming phases) when the water column is likely to experience thermal stratification and is likely to be persistently stably stratified, the rate of destratification is decreased relative to cooler conditions, when penetrative convection can result in enhanced vertical mixing. As such, turbulence and shear stress mixing processes created by hydrodynamic conditions are more important in destratifying potential salt wedges that may occur during warmer conditions (e.g. spring and summer months); and A reduction in river flow and day-to-day seiche events would further increase the persistence of potential salt wedges that may form in the River.
Model “Mitigation” Simulations A range of potential mitigation measured were also modelled, including: A range of Environmental Flow releases (of various magnitude (rate) and durations) Construction of a submerged sill (Salt Trap) in the River Use of a bubble plume mixer at Wellington (for a range of air flow rates) Environmental Flow releases:
Model “Environmental Flow” Simulations Flows at Murray Bridge:
Model “Environmental Flow” Simulations Predicted Salinity at Tailem Bend Near Bed (10 Day Release):
Model “Environmental Flow” Simulations Predicted Salinity at Tailem Bend Near Bed (2 & 5 Day Release):
Model “Environmental Flow” Simulations Predicted Salinity at Wellington Near Bed (10 Day Release):
Environmental Flow SimulationsPredicted Salinity 20th May Base Case 5 GL/Day for 2 Day 10 GL/Day for 2 Day
Model “Mitigation” Simulations Location of Modeled Salt Traps and Bubble Plume Curtain Salt Trap Schematic
Salt Trap SimulationsPredicted Salinity 8th May Base Case Salt Trap B Salt Trap A
Model “Salt Trap A” Simulation Predicted Salinity at Tailem Bend:
Model “Salt Trap B” Simulation Predicted Salinity at Wellington:
Bubble Plume SimulationsPredicted Salinity 8th May Base Case Bubble Plume (50 L/s) Bubble Plume (5000 L/s)
Model “Bubble Plume” Simulations Predicted Salinity at Wellington Near Bed:
Model “Bubble Plume” Simulations Predicted Salinity at Wellington Near Surface:
Model “Bubble Plume” Simulations Predicted Salinity at Tailem Bend Near Bed:
Model Design “Mitigation” Simulations The model results indicate the following: Environmental flows are a potential option for removing salt-wedges from the deeper sections of the River. However, larger flow releases would be required over a short time-frame, which may not be environmentally or economically feasible; Given that complete destratification using environmental flows is probably not feasible, the implementation of smaller, persistent releases to maintain fresh surface conditions at the SA Water off-takes could be considered, if events up to the magnitude of the ANZAC event were to be mitigated against; A submerged weir, to create a salt trap located downstream of Tailem Bend, was predicted by the model to limit the upstream migration of a salt-wedge following a the ANZAC backflow event; A salt trap downstream of Tailem Bend (Salt Trap A) would provide salt wedge storage volume of around 11.4 GL. While the concentration of salt at Wellington increases with a salt trap at this location, the level of protection afforded to Tailem Bend was greatly increased;
Model Design “Mitigation” Simulations The model results indicate the following (cont): Salt Trap B, located downstream of Wellington, was predicted to greatly reduce the concentration of salinity at Wellington during a backflow event, however, the volume of salt captured is significantly less than Salt Trap A. A combination of the two salt traps may be an effective management option; Use of a bubble mixer may be an effective technique at removing salt from the bed of the River following a backflow event; and There is potential for adoption of bubble plume curtains in each of the four deeper pools downstream of Tailem Bend (i.e. approximately 10 km, 15 km, 19 km and 24 km upstream of the mouth of Pomanda Embayment) to further assist with destratification of a salt wedge at these locations.
Model “Worst Case” Simulations Base “worst case” scenario defined as: Lake water levels reduced to -1.5 m AHD Observed wind speeds increased by 25% Increase in Lake salinity by five times (~25000 EC) Additional “worst case” scenarios included: Lake water levels reduced to -0.8 m AHD Lake water levels reduced to -1.5 m AHD Observed wind speeds increased by 25% With extreme Pomanda Embayment sill scour With environmental flows With Salt Trap A
Model “Worst Case” Simulations Predicted Salinity at Wellington Near Bed:
Model “Worst Case” Simulations Predicted Salinity at Tailem Bend Near Bed:
Model “Worst Case” Simulations Predicted Salinity at Tailem Bend Near Surface: