Economic Mobility Study: Understanding Upward Movement in the United States
920 likes | 945 Vues
Explore the concept of economic mobility, its importance, empirical patterns, barriers, and measures in the U.S. society. Gain insights on absolute vs. relative mobility and their impact on policy issues.

Economic Mobility Study: Understanding Upward Movement in the United States
E N D
Presentation Transcript
Economic mobility <location/audience> <date>
National Economic Education Delegation • Vision • One day, the public discussion of policy issues will be grounded in an accurate perception of the underlying economic principles and data. • Mission • NEED unites the skills and knowledge of a vast network of professional economists to promote understanding of the economics of policy issues in the United States. • NEED Presentations • Are nonpartisan and intended to reflect the consensus of the economics profession.
Who Are We? • Honorary Board: 44 members • 2 Fed Chairs: Janet Yellen, Ben Bernanke • 6 Chairs Council of Economic Advisers • Furman (D), Rosen (R), Bernanke (R), Yellen (D), Tyson (D), Goolsbee (D) • 3 Nobel Prize Winners • Akerlof, Smith, Maskin • Delegates: 364 members • At all levels of academia and some in government service • All have a Ph.D. in economics • Crowdsource slide decks • Give presentations • Global Partners: 42 Ph.D. Economists • Aid in slide deck development
Credits and Disclaimer • This slide deck was authored by: • OanaTocoian, Claremont McKenna College • Jon Haveman, NEED • This slide deck was reviewed by: • <name>, <affiliation> • <name>, <affiliation> • Disclaimer • NEED presentations are designed to be nonpartisan. • It is, however, inevitable that the presenter will be asked for and will provide their own views. • Such views are those of the presenter and not necessarily those of the National Economic Education Delegation (NEED).
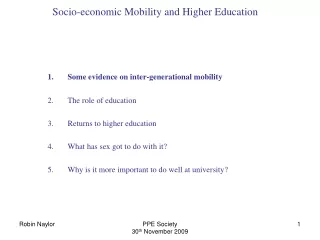
Outline (tentative) I. What do we mean by economic mobility and why does it matter? • Relative vs. absolute; link between mobility, inequality, and growth II. What are the facts? Empirical patterns and cultural context: • Trends: declining absolute mobility, stable relative mobility, int’l comparisons III. What can we make of these patterns? • What is the desirable level of mobility? • Unpacking the causes of the persistence in outcomes. IV. Exploring different barriers to upward mobility – empirical evidence • E.g. access to elite education, business ownership V. Are we using the right measures? Alternative views.
I. What do we mean by economic mobility? Definition and motivation
Economic Mobility – Defined • Economic Mobility – Our working definition: • Ability to advance beyond the status of one’s parents. • More broadly: • The ability to improve your socioeconomic class. • Variety of measures: • Income • Wealth • Education level • Occupation • Home ownership
Absolute and Relative Mobility Consider intergenerational mobility in income. There are two ways in particular that people talk about income mobility: • Absolute mobility: the difference in income from one’s parent. • It is possible for everyone to experience upward absolute mobility. • Relative mobility: the change in income rank from one’s parent. • Increased relative mobility requires both upward and downward movement.
Absolute vs Relative: Escalator Analogy • Absolute Mobility • You’re moving up the escalator. • Relative Mobility • You’re moving up the escalator and passing other people.
Absolute vs. relative mobility vs. growth The three-way link between absolute mobility, relative mobility, and economic growth (=upward absolute mobility of the population as a whole) is not straightforward: • Absolute and relative mobility do not determine each other: exactly doubling all incomes would mean all families experience absolute upward mobility, but none of them experience any relative mobility. • Economic growth does not necessarily mean upward mobility for the whole population. Consider an extreme example: • Suppose there are 100 people and the top earner’s income makes up 10% of total income. If there is 5% growth in total income, but all of the increase goes to the top earner, then: • Only one person experiences upward absolute mobility (50% increase in income) • No one experiences relative income mobility. • Given this, how much does GDP growth tell us about average living standards?
II. Empirical Patterns What are observed levels of mobility?
Mobility – Empirical Patterns Decline in absolute mobility in the United States: • 90% of those born in the early 1940s could expect to earn more than their parents in real terms. For millennials, the fraction is closer to 50% • Below-median earnings have not increased in real terms since the 1970s.
9 out of 10 of those born in the early 1940s could expect to earn more than their parents (after adjusting for inflation) • Only about 1 in 2 Millennials (born after 1980) earn more than their parents.
Source: https://www.eurekalert.org/pub_releases/2017-04/aaft-tfa042417.php
Educational Mobility is Also in Decline https://www.forbes.com/sites/aparnamathur/2018/07/16/the-u-s-does-poorly-on-yet-another-metric-of-economic-mobility/#5566a6726a7b
Poor Kids Are Less Likely to “Out Learn” Parents https://www.forbes.com/sites/aparnamathur/2018/07/16/the-u-s-does-poorly-on-yet-another-metric-of-economic-mobility/#5566a6726a7b
Relative Mobility • Multiple ways to measure changes in relative mobility: • Movement across quintiles in the income distribution. • Transition probabilities • Rank correlation of parent and child’s incomes.
Mobility Example: Perfect Mobility https://www.demos.org/blog/absolute-and-relative-mobility-short-primer
Transition Probabilities in the United States https://www.brookings.edu/wp-content/uploads/2016/06/11_generations_isaacs.pdf
Wealth Mobility https://www.brookings.edu/wp-content/uploads/2016/06/02_economic_mobility_sawhill.pdf
Educational Mobility https://www.brookings.edu/blog/social-mobility-memos/2014/10/27/the-inheritance-of-education/
Reflections on the American Dream https://www.brookings.edu/blog/social-mobility-memos/2018/01/11/raj-chetty-in-14-charts-big-findings-on-opportunity-and-mobility-we-should-know/
American Dream: Geography Matters https://www.brookings.edu/blog/social-mobility-memos/2018/01/11/raj-chetty-in-14-charts-big-findings-on-opportunity-and-mobility-we-should-know/
American Dream: Geography Matters Trends in Absolute Mobility by State: Change from 1940-1980 https://opportunityinsights.org/paper/the-fading-american-dream/
Relative Mobility – Rank Correlation • Rank-based correlation • What are the ranks? • Rank children based on their incomes relative to other children in the same birth cohort • Rank parents of these children based on their incomes relative to other parents • Ask: How correlated are these measures? • Answer: How much does a child’s income rank in adulthood depend on their parent’s income rank when they were growing up?
Intergenerational Mobility – The Abstract no mobility Extreme cases: perfect mobility
Intergenerational Mobility – The Abstract no mobility slope=1 actual mobility slope=0.34 Note that any imprecision in the data will make mobility appear closer to perfect than it is. perfect mobility slope=0
An International Comparison https://scholar.harvard.edu/files/hendren/files/geo_slides.pdf
College Attendance Rates – by Parent’s Income 100% 80% 60% Percent in College at 19 • 84-87 Slope = 0.745 (0.008) 40% 20% 0 20 40 60 80 100 Parent Income Rank https://opportunityinsights.org/paper/recentintergenerationalmobility/
College Quality Rank – by Parent’s Income 80 70 60 Mean College Quality Rank 50 40 • 84-87 Coll. Qual Gradient (P75-P25) = 0.191 • 88-90 Coll. Qual Gradient (P75-P25) = 0.192 • 91-93 Coll. Qual Gradient (P75-P25) = 0.181 30 0 20 40 60 80 100 Parent Income Rank https://opportunityinsights.org/paper/recentintergenerationalmobility/ 1984-87 1988-90 1991-93
Mobility – empirical patterns, cont’d Rank-based correlation, cont’d • Is 0.34 too high or is it reasonable? • [[open question, but probably hard to assess intuitively]] • This number has not changed significantly in the past 50 years. But inequality (the spread of the distribution) has increased, meaning that which family one is born into has greater consequences for one’s quality of life. Rank-based correlation only speaks to average outcomes, and does not tell us – for instance – how likely disadvantaged children are to climb to the top of the income distribution.
Public Perception and Sentiment • Relative: “American Dream” vs “Old World” • General belief is that the U.S. has greater mobility than elsewhere. • Fewer explicit barriers – no nobility titles. • More meritocratic – “rags to riches”, Heratio Alger • Absolute: Overestimate of actual mobility • The American Dream plays a significant part in national identity. • Common perception is incorrect.
Intergenerational Elasticity – of Income • Most common measure of relative mobility (IGE): • Q: What is the relationship between the family income of parents and the family income of their child? • A lower IGE implies more economic mobility • Problems with IGE: • Strongly influenced by income inequality. • Strongly affected by data used: • Age range • Can’t include people with zero earnings • Etc.
IGE: U.S. in International Comparison https://www.epi.org/publication/usa-lags-peer-countries-mobility/
Most Americans Overestimate Mobility https://www.sciencedirect.com/science/article/pii/S0022103115000062
Most Americans Overestimate Mobility https://www.sciencedirect.com/science/article/pii/S0022103115000062
The “American Dream” Shapes Perceptions https://www.brookings.edu/wp-content/uploads/2016/06/02_economic_mobility_sawhill.pdf
Education Does Matter – at All Income Levels https://www.brookings.edu/wp-content/uploads/2016/06/02_economic_mobility_sawhill.pdf
Mobility – Important Relationships • Mobility and Inequality • What is the relationship between the two? • Makes both absolute and relative mobility more difficult. • Mobility and Growth • What is the relationship between the two? • Growth drives absolute mobility. • Mobiity drives growth. • Primarily through individual actions: investments in productive capacity and effort.
Peru China Brazil Germany U.S. Canada https://equitablegrowth.org/research-paper/are-todays-inequalities-limiting-tomorrows-opportunities