
Results
Applying Nonlinear Causal Resource Analysis Methods to Incorporation of Personality Traits in Performance Models for Education and Work. Tara Alavi, George V. Kondraske, Ph.D., Advisor Department of Electrical Engineering, The University of Texas at Arlington, Arlington, Texas 76019.

Results
E N D
Presentation Transcript
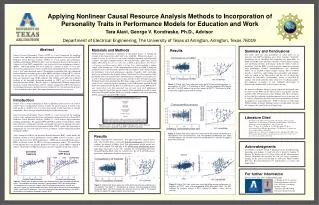
Applying Nonlinear Causal Resource Analysis Methods to Incorporation of Personality Traits in Performance Models for Education and Work Tara Alavi, George V. Kondraske, Ph.D., Advisor Department of Electrical Engineering, The University of Texas at Arlington, Arlington, Texas 76019 Abstract General Systems Performance Theory (GSPT) is a novel framework for modeling systems, tasks, and their interface from a performance perspective. Derived from GSPT, Nonlinear Causal Resource Analysis (NCRA) is a task analysis and performance modeling methodology. NCRA provides a way to estimate the degree of performance in a higher-level task (HLT) supported by a set of lower level basic performance resources (BPRs). GSPT and NCRA have been applied in a number of fields; we were now interested in applying them to better understand the relationship between characteristics such as “grit” and educational success. We identified a published study (the relationship between cognitive and non-cognitive skills (BPRs) and labor earnings (HLT)) with raw data that, thus far, most closely matched our needs. Data was extracted from scatter plots and reanalyzed using NCRA concepts. This yielded scatter plots that exhibited evidence of the threshold relationship predicted by GSPT and a set of Resource Demand Functions (RDFs). Results suggest a fundamentally different interpretation than that assumed with correlation analysis, which is explained by GSPT to be incorrect for relating performance capacities across hierarchical levels. Our method also provides a basis to find each individual’s limiting performance resource for a given task. Materials and Methods Published papers pertaining to prediction of educational success or utilizing the concept of the characteristic called “grit” were identified. Within those papers, we sought out access to raw data via scatter plots including dependent and independent variables. Few papers included such data. We used data from a paper (Diaz, Arias & Tudela; 2012) titled: Does Perseverance Pay as Much as Being Smart?: The Returns to Cognitive and Non-cognitive Skills in Urban Peru, which included a random sample of the working-age (14-50) urban population in Peru (n=2,660). Participants completed surveys that measured cognitive and non-cognitive skills, which comprise the participants’ lower level performance capacities. Cognitive skills: intellectual ability was measured by the Peabody Picture Vocabulary Test. Non-cognitive skills: personality traits were measured by Conscientiousness(a Big Five personality trait), as well as Grit personality traits (perseverance and will to strive for long term goals). Published scatter plots positioned the HLT (log earnings) on the Y axis and the BPR on the X axis. Analyzing the data according to the NCRA model required that the points be re-plotted so that the HLT is reflected on the X axis and the BPR on the Y axis. Scatter plots were then generated (one for each lower level performance resource using the log of labor market earnings as the independent variable in each). A Resource Demand Function (RDF) was manually added to each scatter plot using NCRAutilizing the specified NCRA strategy. Results Summary and Conclusions Our results show that data distributions in scatter plots are all consistent with GSPT predictions and a lower boundary “threshold” relationship can be identified, thus supporting the applicability of GSPT and NCRA cause-and-effect constructs to labor market earnings and questioning previous performance prediction efforts based on correlation. From the RDFs, a relatively greater amount of a particular basic performance resource (conscientiousness, grit, intellectual ability, etc.) is required to achieve higher earnings. The set of RDFs provides a model for understanding how personality and cognitive skills are valued in the labor market, and the way in which they influence an individual’s socioeconomic success as measured by earnings. The results from this study could serve to influence policies that emphasize investments in early childhood interventions to increase non-cognitive skills as they begin to develop. We intend to collaborate directly with the authors of the original study in order to create RDFs for the other measures of cognitive and non-cognitive skills. We then plan to share findings with other researchers to show that the traditional correlation approach is not an accurate way to analyze relationships between lower level performance resources and higher level task performance. While we did not yet fully apply NCRA methods to identify limiting resources for individuals who had low earnings, this would be the next logical step. “Threshold” GSPT Based Correlation Traditional Figure 4. Original (left) linear regression scatter plot of log earnings performance vs. non-cognitive skill GRIT 2: “Persistence of Effort” and corresponding NCRA-based plot (right).The RDF indicates the minimum amount of GRIT 2: “Persistence of Effort is required to support a given level of earnings. Introduction If there exists a certain combination of skills an individual needs to possess in order to achieve success in educational contexts or make the greatest amount of money in the labor market, it would be wise to assume many people would regard this as valuable information. This is the type of problem of interest in the present study. General Systems Performance Theory (GSPT) is a novel framework for modeling systems, tasks, and their interface from a performance perspective. Derived from GSPT, Nonlinear Causal Resource Analysis (NCRA) is a task analysis and performance modeling methodology. We applied GSPT and NCRA methods to this problem. While many others have attempted to develop such models, the universal approach used relies on statistical, correlation-based regression methods. GSPT explains that correlation is inappropriate for such tasks and gives rise to an alternate systems engineering method, specifically NCRA. A key concept in NCRA is the Resource Demand Function (RDF), which defines the minimum amount of a basic performance resource (BPR) required to achieve a given level of higher level task (HLT) performance. A BPR can also limit HLT performance. BPRs are plotted against the HLT to develop performance models. The correlation-based approach does not properly identify how much of a given BPR is required to achieve a desired level of HLT performance, nor does it identify the limiting resource. • Literature Cited • Kondraske, G.V. (2011). General Systems Performance Theory and Its Application to Understanding Complex System Performance. Information • Knowledge • Systems Management, 10 (1-4), 235-259. • Diaz, J. J., Arias, O., & Tudela, D. V. (2012, November 30). Does Perseverance Pay as Much as Being Smart?: The Returns to Cognitive and Non-cognitive Skills in urban Peru. • Duckworth, A. L., Peterson, C., Matthews, M. D., & Kelly, D. R. (2007). Grit: Perseverance and passion for long-term goals. Journal of Personality and Social Psychology, 92(6), 1087-1101. Figure 2. Portion of first page of published paper from which data was extracted and re-analyzed using GSPT and NCRA concepts. Results Figures 3 through 6 are shown below. Each figure represents a pair of scatter plots. The left plot shows a scatter plot from the original paper (with the log of earnings, the measure of Higher Level Task performance) plotted against one of the skills studied. The right plot is the NCRA-based consideration of the same data represented on the left, including the corresponding Resource Demand Function (RDF). Note the switched axes. The set of all NCRA-based plots form a performance model for work success. Figure 5. Original (left) linear regression scatter plot of log earnings performance vs. non-cognitive skill conscientiousness and corresponding NCRA-based plot (right). The RDF indicates the minimum amount of conscientiousness required to support a given level of earnings. Acknowledgments I would like to thank Dr. George V. Kondraske for his incredible insight, knowledge, and guidance. I would also like to thank Dr. Jonathan W. Bredow, Dr. Kambiz Alavi, Dr. Qilian Liang, and Mr. Mohammadreza Jahangir Moghadam for providing me with this unique opportunity. Funding for this project was provided by (NSF grant #EEC-1156801, REU Site: Research Experiences for Undergraduates in Sensors and Applications). For further information Please contact Tara Alavi atalavi@utexas.edu. G. Kondraske, Ph.D. (advisor) Human Performance Institute Univ. of Texas at Arlington PO Box 19180 Arlington, TX 76019-0180 E-mail: kondraske@uta.edu Figure 1. Scatter plots of representative types of performance data spanning hierarchical levels. The traditional correlation thinking is contrasted with GSPT threshold concepts. The horizontal axis represents Higher Level Task Performance and the vertical axis represents one of the multiple lower level Basic Performance Resources that contribute to Higher Level Task Performance. The curve representing the lower boundary in the GSPT-based plot is the Resource Demand Function (RDF). Figure 6. Original (left) linear regression scatter plot of log earnings performance vs. cognitive skill PPVT score and corresponding NCRA-based plot (right).The RDF indicates the minimum amount of PPVT required to support a given level of earnings. Figure 3. Original (left) linear regression scatter plot of log earnings performance vs. non-cognitive skill GRIT 2: “Consistency of Interest” and corresponding NCRA-based plot (right). The RDF indicates the minimum amount of GRIT 2: “Consistency of Interest required to support a given level of earnings.


