Instrument location
170 likes | 319 Vues
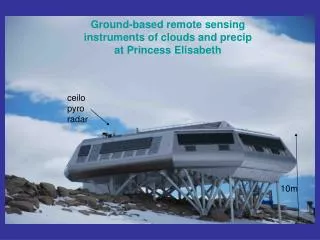
Instrument location. Ground-based remote sensing instruments of clouds and precip at Princess Elisabeth. ceilo pyro radar. 10m. Cloud properties. Ceilometer. Infrared Radiation Pyrometer. pulsed diode laser in near IR (910nm)

Instrument location
E N D
Presentation Transcript
Instrument location Ground-based remote sensing instruments of clouds and precip at Princess Elisabeth ceilo pyro radar 10m
Cloud properties Ceilometer Infrared Radiation Pyrometer • pulsed diode laser in near IR (910nm) • vertical backscatter profiles and cloud base height detection up to 7.5 km • range resolution = 10m • report interval = 15s (transfer time of • accumulated signal) • passive radiometer: equivalent blackbody brightness temperature in 8-13 micron atm window • cloud base temperature (assuming =1)
- visibility below threshold (as defined for pilots) • sharp change in visibility • If these criteria not met => VV “cloud bottom” exists • Vaisala algorithm is used for cloud base detection • - lidar equation is inverted using Klett (1981) algorithm assuming where k2=1 - assumptionvalid for optically thick liquid clouds (Krasnov and Russchenberg 2002; Rocadenbosch et al. 1999) => remote visibility • Applied to PE: • liquid cloud bottom well defined • problems with ice clouds: algorithm identifies cloud top as cloud bottom • during precipitation/drifting snow - fake cloud bottom heights (=>low cloud bias during storm)
Apply new algorithm to cloud base detection:THT (Temporal Height Tracking)Martucci et al. 2010) • The THT scheme is based on the information about the mutual positions of the local • maxima in the attenuated backscatter coefficient vertical profile and it’s vertical gradient: where 1) lidar equation => 2) gradient • i = single successive measurements in the selected period (eg, 10min) with time • resolution of recorded profile (3 s) => temporal evolution of GSi (average over 10min • ensures relatively invariable cloud base initiating the algorithm • heights of the largest 10min-mean(GS) and 10-minmean(beta) maxima => reference height • look for principal maxima of GS and beta in a limited interval around href => find GS(max) > threshold and beta(max) => mean between the two = CBH
Jan 25, 16 utc:mid level cloud containing liquid from SE cloud height = 3km optically thick liquid clouds - well defined cloud bottom height
Jan 31, 15 utc:ice cloud/precip in the 500-2000m layer ice clouds/virga: errors in Vaisala-detected CBH (precipitation-type profile; Vaisala algorithm gives cloud top instead of cloud bottom)
Jan 31, 15 utc:virga in the ~500-2000m layerdetected by MRR Radar equivalent reflectivity
500hPa near surface (10m) Synoptic chart: 7 Feb, 2010 storm Feb 6 pe pe Feb 7 pe Operational meteo information from Neumayer station (ECMWF)
IR composite imageFeb 7, 201009 UTC: pe AMRC, UW-Madison thanks to Matthew Lazzara and his team
6 Feb, 8 utc 2 cloud layers detected: ~1.2 km, CBT = -18 C ~3 km, CBT = -35 C liquid? virga-type ice crystals
6 Feb, 15utc icy cloud liquid? CBH = 2.5km CBT = -35 C
Feb 7, 01utc CBH = 1.5 and 3-4 km CBT = -25 C glaciated cloud light precipitation
Feb 7, ~3utc: ceilo detectsbeginning of precipitation cloud probably with liquid very light precip 4 5 Height, m data gap very weak radar signal...
Height, m data gap Feb 7, ~8utc: blowing snow blowing snow attenuates lidar signal radar detects intensive precipitation, while ceilo completely attenuated