Download
1 / 21
210 likes | 232 Vues
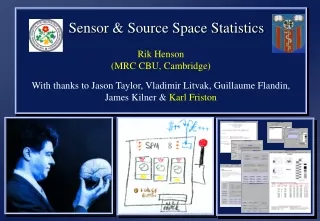
Sensor & Source Space Statistics Rik Henson (MRC CBU, Cambridge) With thanks to Jason Taylor, Vladimir Litvak , Guillaume Flandin , James Kilner & Karl Friston. 8. Overview.

E N D
Sensor & Source Space Statistics Rik Henson (MRC CBU, Cambridge) With thanks to Jason Taylor, Vladimir Litvak, Guillaume Flandin, James Kilner & Karl Friston 8
Overview • A mass-univariate statistical approach to localising effects in space/time/frequency (using replications across trials/subjects)…
Overview • Sensor Space: • Random Field Theory (RFT) • 2D Time-Freq (within-subject) • 3D Scalp-Time (within-subject) • 3D Scalp-Time (between-subjects) • Source Space: • 3D “time-freq” contrast images • SPM vs SnPM vs PPM vs FDR • Other issues & Future directions • Multivariate
1. Random Field Theory (RFT) RFT is a method for correcting for multiple statistical comparisons with N-dimensional spaces (for parametric statistics, eg Z-, T-, F- statistics)… • When is there an effect in time, eg GFP (1D)? • Where is there an effect in time-frequency space (2D)? • Where is there an effect in time-sensor space (3D)? • Where is there an effect in time-source space (4D)? Worsley Et Al (1996). Human Brain Mapping, 4:58-73
2. Single-subject Example • “Multimodal” Dataset in SPM8 manual (and website) • Single subject: 128 EEG 275 MEG 3T fMRI (with nulls) 1mm3 sMRI • Two sessions • ~160 face trials and ~160 scrambled trials per session • (N=12 subjects soon, as in Henson et al, 2009 a, b, c) Chapter 33, SPM8 Manual
2. Where is an effect in time-frequency (2D)? • Single MEG channel • Mean over trials of Morlet Wavelet projection (i.e, induced + evoked) • Write as t x f x 1 image per trial • SPM, correct on extent / height Faces > Scrambled Faces Scrambled Kilner Et Al (2005) Neurosci. Letters Chapter 33, SPM8 Manual
3. Where is an effect in scalp-time space (3D)? • F-test of means of ~150 EEG trials of each type • 2D sensor positions specified or projected from 3D digitised positions • Each sample projected to a 32x32 grid using linear interpolation • Samples tiled to created a 3D volume t Chapter 33, SPM8 Manual y x • Note: location of EEG maxima depends on reference • Note: location of MEG radial flux maxima (Mags or Axial Grads) doesn’t correspond to location of source • Note: cluster-level inference less useful in both cases (where sensor extent not related to source extent)
3. Where is an effect in scalp-time space (3D)? More sophisticated 1st-level design matrices, e.g, to remove trial-by-trial confounds within each subject, and create mean adjusted ERP for 2nd–level analysis across subjects Each trial-type (6) Confounds (4) Across-subjects (2nd-level) Each trial Within-subject (1st-level) beta_00* images reflect mean (adjusted) 3D scalp-time volume for each condition Henson Et Al (2008) Neuroimage
4. Where is an effect in scalp-time space (3D)? Mean ERP/ERF images can also be tested between-subjects. Note however for MEG, some alignment of sensors may be necessary (e.g, SSS, Taulu et al, 2005) Without transformation to Device Space With transformation to Device Space Stats over 18 subjects on RMS of 102 planar gradiometers Taylor & Henson (2008) Biomag
Overview • Sensor Space: • Random Field Theory (RFT) • 2D Time-Freq (within-subject) • 3D Scalp-Time (within-subject) • 3D Scalp-Time (between-subjects) • Source Space: • 3D contrast images • SPM vs SnPM vs PPM (vs FDR) • Other issues & Future directions • Multivariate
Where is an effect in source space (3D)? Source analysis of N=12 subjects; 102 magnetometers; MSP; evoked; RMS; smooth 12mm 1. Estimate evoked/induced energy (RMS) at each dipole for a certain time-frequency contrast (e.g, from sensor stats, e.g 0-20Hz, 150-200ms), for each condition (e.g, faces & scrambled) and subject 2. Smooth along the 2D surface 3. Write these data into a 3D image in MNI space (if canonical / template mesh used) 4. Smooth by 8-12mm in 3D (to allow for normalisation errors) Analysis Mask Note sparseness of MSP inversions…. Henson Et Al (2007) Neuroimage
Where is an effect in source space (3D)? Source analysis of N=12 subjects; 102 magnetometers; MSP; evoked; RMS; smooth 12mm • 1. Classical SPM approach • Caveats: • Inverse operator induces long-range error correlations (e.g, similar gain vectors from non-adjacent dipoles with similar orientation), making RFT conservative • Need a cortical mask, else activity “smoothed” outside • Distributions over subjects may not be Gaussian (eg MSP unless smooth a lot)… p<.05 FWE SPM Taylor & Henson (210) Biomag
Where is an effect in source space (3D)? Source analysis of N=12 subjects; 102 magnetometers; MSP; evoked; RMS; smooth 12mm • 2. Nonparametric, SnPM • Robust to non-Gaussian distributions • Less conservative than RFT when dfs<20 • Caveats: • No idea of effect size (e.g, for future experiments) • Exchangeability difficult for more complex designs SnPM p<.05 FWE Taylor & Henson (2010) Biomag
Where is an effect in source space (3D)? Source analysis of N=12 subjects; 102 magnetometers; MSP; evoked; RMS; smooth 12mm • 3. PPMs • No need for RFT (no MCP!?) • Threshold on posterior probability of an effect (greater than some size) • Can show effect size after thresholding… • Caveats: • Assume normal distributions (e.g, of mean over voxels); sometimes not met for MSP (though usually fine for IID) PPM p>.95 (γ>1SD) Grayscale= Effect Size Taylor & Henson (2010) Biomag
Where is an effect in source space (3D)? Source analysis of N=12 subjects; 102 magnetometers; MSP; evoked; RMS; smooth 12mm • 4. FDR? • Choose an uncorrected threshold (e.g, p<.001) to define topological features, e.g, peak and cluster size • Topological FDR actually produces higher corrected p-values (i.e, fewer suprathresholdvoxels) than FWE in the data used here • If sources are constrained to a graymatter cortical surface, are topological features as meaningful? p<.001 unc SPM Taylor & Henson (2010) Biomag
Where is an effect in source space (3D)? Some further thoughts: • Since data live in sensor space, why not perform stats there, and just report some mean localisation (e.g, across subjects)? True but: What if sensor data not aligned (e.g, MEG)? (Taylor & Henson, 2008)? What if want to fuse modalities (e.g, MEG+EEG) (Henson et al, 2009)? What if want to use source priors (e.g, fMRI) (Henson et al, in press)? What if one wants to make an inference about a specific cortical region? • Contrast localisations of conditions, or localise contrast of conditions? “DoL” or “LoD” (Henson et al, 2007, Neuroimage) LoD has higher SNR (though difference only lives in trial-average, i.e evoked)? But how then test localised energy of a difference (versus baseline?) Construct inverse operator (MAP) from a difference, but then apply that operator to individual conditions (Taylor & Henson, in prep)
Future Directions • Extend RFT to 2D cortical surfaces (“surfstat”) • Go multivariate… • To localise (linear combinations) of spatial (sensor or source) effects in time, using Hotelling-T2 and RFT • To detect spatiotemporal patterns in 3D images(MLM / PLS) Pantazis Et Al (2005) NeuroImage Carbonell Et Al (2004) NeuroImage Barnes & Litvak (2010) Biomag Duzel Et Al (2003) Neuroimage Kherif Et Al (2004) NeuroImage
Multivariate Model (MM) toolbox Multivariate Linear Model (MLM) across subjects on MEG Scalp-Time volumes (now with 3 conditions) Famous Novel Scrambled Famous Novel Scrambled Sensitive (and suggestive of spatiotemporal dynamic networks), but “imprecise” X “M170”? Kherif Et Al (2004) NeuroImage