The Normal Distribution: Bell Curve Characteristics and Empirical Rule
80 likes | 107 Vues
Learn about the key characteristics of a Bell Shaped Curve, the Empirical Rule, and Control Charts for sequential data. Discover how to graph a normal distribution and interpret control signals to maintain data quality.

The Normal Distribution: Bell Curve Characteristics and Empirical Rule
E N D
Presentation Transcript
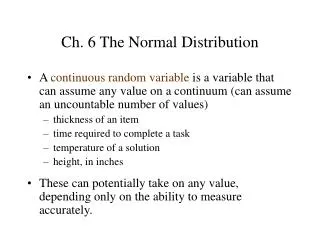
Do you know the Normal Distribution? Of course you do. Many of you have talked abut a Normal Curve. The other magic phrase is the Bell Shaped curve. What are the characteristics of a Bell Shaped Curve? 1. Smooth 2. Symmetrical about μ and peaks at μ 3. Has inflection points at μ ± σ 4. Never touches the x axis
The Empirical Rule For a distribution that is symmetrical and bell shaped (in particular is normal) - Approx. 68% of the data will be within 1 Standard Deviation on each side of μ - Approx. 95% of the data will be within 2 Standard Deviations on each side of μ - Approx. 99.7% of the data will be within 3 Standard Deviation on each side of μ Sounds like Chebyshev’s Theorem… (note that Chebyshev’s applies to ALL distributions where this empirical rule replies only to Normal Distributions
Control Chart Shows Sequential Data and its relationship to μ in terms of σ (location of dashed lines..) Can be thought of as a “warning device” should data start to veer beyond a certain point
Statistical Control A control chart of the data shows that the data, over time, is continuing to behave in generally the same manner…
Out of Control Signals 1. One point beyond 3σ (the probability of something being beyond that point is .3 percent) 2. Nine consecutive points on one side of the center line (μ) 3. Two of three consecutive points lie beyond 2σ on the same side of the center line.
To graph a normal distribution.. Press Y= Press Distr Select 1: normalpdf(x,μ,σ) Press Window and set the min and max values to μ ± 3σ Press Zoom and choose 0: Zoomfit
Resources • http://www.case.edu/med/epidbio/mphp439/CQI.htm