Download
1 / 36
380 likes | 497 Vues
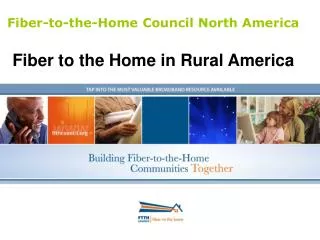
Fiber-to-the-Home Council North America. North American FTTH Deployment Update. Presented by: Michael C. Render. Vendor information and interviews (nearly all). Provider information and detailed interviews (over 1/3). Consumer input (initial 100K panel). Current FTTH Status.

E N D
Fiber-to-the-Home Council North America North American FTTH Deployment Update Presented by: Michael C. Render
Vendor information and interviews (nearly all) Provider information and detailed interviews (over 1/3) Consumer input (initial 100K panel)
FTTH Homes PassedCumulative – North America RVALLC 2009 RVALLC 2007
FTTH Homes Marketed Cumulative – North America RVALLC 2009 RVALLC 2007
FTTH Homes ConnectedCumulative – North America RVALLC 2009 RVALLC 2007
FTTH Penetration Cumulative – United States RVALLC 2009 RVALLC 2007
FTTH Video Homes Connected(Cumulative – North America) RVALLC 2009 RVALLC 2007
Overall Take-Rate For FTTH (Cumulative – North America) RVALLC 2009 Note: Percent of all homes-marketed taking something over fiber.. RVALLC 2007
Overall Take-Rate For FTTH Non RBOC Cumulative – North America By Year RVALLC 2009 RVALLC 2007
RBOC Take-Rate For FTTH Cumulative – North America RVALLC 2009 RVALLC 2007
Year-To-Year Growth In Homes Connected (12 month averages) Note: Years since start of installations RVALLC 2009
Current Status Of FTTH Growth In North America By Country
Current Status Of FTTH Growth United States By Provider Type
Three Year Change in Connections RVALLC 2009
FTTH Homes Connected By SegmentCumulative – North America RVALLC 2009 Note: Does not show first half 2009 RVALLC 2007
Verizon (10% of their 32 million customers connected with fiber) • Drivers: • Need for new model • FTTH Council member • Visionary view • Outside plant setup • Regulation changes
Small Rural Telephone Companies (8% of their 8 million customers connected with fiber) • Drivers: • Aging copper lines • Television opportunity • Pioneering tradition • Subsidies Note: This rural telephone association map shows some, but not all, Tier 3 ILECs
FTTH Connection Penetration By Zip Code Density (Density = Homes per sq mile) RVALLC 2009
The Importance of Smaller Players RVALLC 2009 * Includes CLECs that are divisions of ILECs
Likelihood Of Deploying FTTH Within 3 Years Tier 3 ILECs Currently Not Deploying FTTH RVALLC 2009
Additional 2009 Growth Anticipated Tier 3 ILECs Currently Deploying FTTH RVALLC 2009
Likelihood Of Deploying FTTH Within 3 Years Tier 3 ILECs Currently Not Deploying FTTH RVALLC 2009
Additional 2009 Growth Anticipated Tier 3 ILECs Currently Deploying FTTH RVALLC 2009
Effect of U.S. Stimulus Plan • Some “de-stimulus” early 2009 • Some stimulus beginning late 2009
Likelihood Of Deploying More By Incentive Tier 3 ILECS (Percent rating somewhat or much more likely) RVALLC 2009
Likelihood Of Deploying More By Incentive Municipalities (Percent rating somewhat or much more likely) RVALLC 2009
2008 Research Continues To Show FTTH Users Work One AdditionalDay Per Month At Home Due To FTTH Days worked from home increased: • Nearly 9% work more from home directly because of FTTH – an average of 11 days more
Internet Customer Satisfaction Comparison With Other Services (Those somewhat or very satisfied) RVALLC 2009 * From 2006 data
Peak Bandwidth Demand Per Average FTTH User Including Internet Download And IPTV HD Devices RVALLC 2009
Percent Believing Future Non Entertainment FTTH Applications Are Important Among Those 55 And Over RVALLC 2008
Fiber-to-the-Home Council North America North American FTTH Deployment Update Presented by: Michael C. Render