Download
1 / 27
270 likes | 505 Vues
IAP vs Z-Score Classification for Growth Charts. A.K.Nigam Director Institute of Applied Statistics and Development Studies.

E N D
IAP vs Z-Score Classification for Growth Charts A.K.Nigam Director Institute of Applied Statistics and DevelopmentStudies
Prevention and management of severely malnourished children is an important component of the ICDS and IMCI (Integrated Management of Children Illness) strategy. WHO also emphasizes on the management of severely malnourished children. • Prevalence of malnutrition in children is described in terms of the percentage of individuals below a specific cut-off, such as certain per cent of the median or standard deviation (sd) in terms of z scores of the reference population. Classifications like Gomez’s or Indian Association of Pediatricians (IAP) are on the basis of cut - off points as percentage of median (reference) weight-for-age.
NNMB/NIN reports (UNICEF also in some studies) nutritional status using each of these classifications with no inter-comparisons and guidelines about which one should be used for programme interventions. • SD classifications are now widely used by major stake holders like WHO, USAID among others. NFHS – I, II, and the latest III, the largest national surveys, which form the basis for planning by policy makers and programme implementers, present nutritional status data in terms of sd classifications only. • One is therefore in a dilemma which classification to use.
Although sd classification has distinct statistical advantages over others, its use is not widespread, mainly because it is felt (though erroneously) that it involves relatively cumbersome calculations. Even research workers find them difficult, as it needs development of appropriate software for different indicators of nutritional status. • Because of this, ICDS uses IAP classification. At each AWC, the Anganwadi Worker has to prepare and monitor growth chart for each child. These charts are based upon IAP classification and use 60% of median (standard) weight-for-age for identifying severely malnourished children. • It is known that the prevalence of severe malnutrition as derived by ICDS functionaries is far below in comparison to that reported by NFHS and other nutrition surveys. Even for the same survey (say, NNMB/NIN) the prevalence of severe malnutrition using below –3sd cut-off is much higher in comparison to that obtained using IAP cut-off of 60% of median weight.
Gap between NCHS reference and IAP classification in assessing severe undernutrition in boys
Nigam (2003) showed that 3sd cut-off matches with 67% of median (standard) weight-for-age. One readily notices the rationale behind the gap in reporting by realizing that 3sd cut-off corresponds to 67% (instead of 60% as in IAP) of median (standard) weight-for-age. • The equivalence relation facilitates the use of sd classification under field conditions and also by research workers. The growth charts, in terms of both IAP and sd classifications are given in another paper by Nigam (2005) separately for boys and girls. These charts can replace the existing growth charts at AWC.
A comparison was made by Nigam (2005) between the two approaches, 60% and 67% of median, to evaluate the percentage of severely malnourished children being left out by IAP classification which is being used by agencies like ICDS. For this, district level results from the NIN/IASDS district level Reports from the study – Nutrition Profile of Community in Uttar Pradesh, were utilized for Uttar Pradesh and Uttaranchal states.
At the State level, 61.1% of severely malnourished children were left out in UP. At the regional level, in Uttar Pradesh, these left out percentages were – 58.1 in Western region, 59.9 in Central, 67 in Eastern and 53.4 in Bundelkhand. In numbers, in UP alone, out of about 6 million estimated severely malnourished children; over 3.5 million such children were likely to be left out.
The results reveal and support earlier findings that the percent of median cut-off points under IAP do not capture a substantial number of children identified as malnourished through sd / z- score classifications. • As in most programme intervention projects, only severely malnourished are targeted and monitored, the huge gap in the two assessments also raises ethical considerations. • As ICDS uses IAP classifications for growth monitoring and identifying severely malnourished children, it is not difficult to realize the gravity and magnitude of the problem with regard to left out severely malnourished children at the national level. Corrective measure in this direction would prove to be very effective in tackling malnutrition deaths.
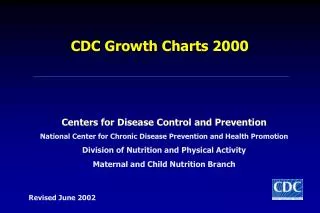
New WHO growth standards for assessing severe undernutrition in boys
New WHO growth standards for assessing severe undernutrition in boys
Growth Curves (Severe Undernutrition) For Boys From WHO And NCHS Populations (0-59 months)
Growth Curves (Severe Undernutrition) For Boys From WHO And NCHS Populations (0-24 months)
Growth Curves (Severe Undernutrition) For Boys From WHO And NCHS Populations (24-59 months)
WHO Standards – Some Observations/Concerns • It is seen that in 24-59 month period -3sd cut-offs vary considerably with average cut-off &70% of median. • Because for weight-based measures outer tails are highly affected by even few extreme data points. • This could also be because of lower emphasis given to uniformity on different aspects of complementary feeding – initiation, quantity, quality and frequency among children of cross-sectional group. This perhaps explains lower dropouts in cross-sectional design • A limitation of WHO standards is non inclusion of some important ethnic groups (South East Asia, Australia, NZ etc.), and even in India children from cities from South and East. • The overall design, a mix of longitudinal and cross-sectional generates confounding – overlapping between 18-24 months, uneven visits in cross-sectional design. • WHO standards are limited to 0-59 months children; what about older children?
Overall Conclusion • No single cut-off is entirely satisfactory • More stratification is required within each country • For some time both NCHS and WHO should be concurrently used on pilot basis.
Weight For Age Tables For BOYS and GIRLS In NCHS Reference Population
Percentage of severely malnourished children left out by IAP classification