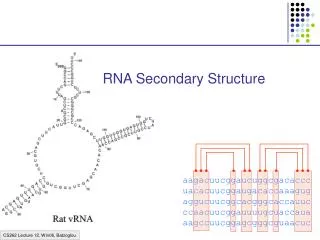
RNA Secondary Structure
RNA Secondary Structure. RNA Structure Prediction. FoldRNA Various graphic display options MFold PlotFold StemLoop. Structural Prediction Limitations. Gunnar von Heijne 1987


RNA Secondary Structure
E N D
Presentation Transcript
RNA Structure Prediction • FoldRNA • Various graphic display options • MFold • PlotFold • StemLoop
Structural Prediction Limitations • Gunnar von Heijne 1987 • "Unfortunately, one cannot trust the output of these programs to even approximately represent the true in vivo structure"
Considerations • "We should be quite remiss not to emphasize that despite the popularity of secondary structural prediction schemes, and the almost ritual performance of these calculations, the information available from this is of limited reliability. This is true even of the best methods now known, and much more so of the less successful methods commonly available in sequence analysis packages. Running a secondary structure prediction on a newly-determined sequence just because everyone else does so, is to be deplored,and the fact that the results of such predictions are generally ignored is insufficient justification for doing and publishing them." • -Arthur Lesk 1988
Problems with Fold Predictions • Prediction limited by accuracy of free energy calculations • Different tables of free energy values give different results. • Folding may initiate in a 5'-3' direction as the molecule is being synthesized. • Conformation may change to find an "optimum" structure but one which does not necessarily have the lowest free energy.
Problems with Fold Predictions • Unpaired loops may interact giving alternate structures. • Base modifications (tRNA) may alter the structure. • Interactions with other RNAs and with proteins may affect the final structure. • Fold reports the one "best" structure. There may be many others with equally favorable free energy states.
Some of the Solutions • Combine computer predictions with biological data • Crystal structure • RNAs difficult to crystallize • Enzymatic probing • Use single-strand and double-strand specific nucleases to probe the structure of isolated RNAs
Some of the Solutions • Derivation of better tables for stacking and loop energies • Force the computer to constrain areas of the structure to some specifically paired or unpaired regions as predicted by the biological data. • Use programs that generate suboptimal foldings in addition to the one "best" structure • Mfold • Look for evolutionarily conserved structures
Factors Used to Predict RNA Folding • Base pairing • GC (3); AU (2); GU (1) • Stabilizing effects of stacking energies of base pairs present in the stem. • Destabilizing affects of unpaired loops Hairpins, bulges, etc.
MFold • Prediction of optimal and suboptimal RNA secondary structures • Method of Zucker • Look for base pairings that vary the least when scanning a series of optimal and suboptimal structures • Display output with PlotFold
RNA Energy Tables -DATa1=dangle.mfoldr037 assigns energies for single base stacking -DATa2=loop.mfoldr037 assigns destabilizing energies for internal, bulge, and hairpin loops -DATa3=stack.mfoldr037 assigns energies for base stacking -DATa4=tstackh.mfoldr037 assigns energies for terminal mismatched pairs in hairpin loops -DATa5=tstacki.mfoldr037 assigns energies for terminal mismatched pairs in interior loops -DATa6=tloop.mfoldr037 assigns bonus energies for recognized "tetraloops" -DATa7=miscloop.mfoldr037 assigns energies for multi-branched and asymmetric interior loops
DNA Energy Tables -DATa1=dangle.mfoldd037 assigns energies for single base stacking -DATa2=loop.mfoldd037 assigns destabilizing energies for internal, bulge, and hairpin loops -DATa3=stack.mfoldd037 assigns energies for base stacking -DATa4=tstackh.mfoldd037 assigns energies for terminal mismatched pairs in hairpin loops -DATa5=tstacki.mfoldd037 assigns energies for terminal mismatched pairs in interior loops -DATa6=tloop.mfoldd037 assigns bonus energies for recognized "tetraloops" -DATa7=miscloop.mfoldd037 assigns energies for multi-branched and asymmetric interior loops
Restrictions • Maximum of 1,400 bases • Run in Batch mode
Folding Constraints • Force base pairings • Prevent base pairings • Remove bases from consideration • Maximum loop sizes
Loop Parameters • -MAXLoopsize=30 • set the maximum size for an interior or bulge loop in the predicted secondary structures. An interior loop is an unpaired region interrupting a helix, with unpaired bases on both strands of the interrupted region. A bulge loop is a loop-out in a helix involving only one of the helix strands. The size of the loop is the total number of unpaired bases in the loop. • -LOPsidedness=30 • sets the maximum lopsidedness for an interior or bulge loop in the predicted secondary structures. For an interior loop, this is the maximum difference between the number of single-stranded bases on one side of the loop and the number of single-stranded bases on the other side. For a bulge loop, this is the maximum number of bases in the loop
Force Folding • -FORCe1=i,j,k ... -FORCe9=x,y,z • forces the helix that begins with the base pair between bases i and j and extends for k bases to the base pair between i+k-1 and j-k+1. • If j is 0, then the sequence of k consecutive bases, beginning with base i, is forced to be double-stranded (although the pairing partner for each base is not specified). • You can force up to 9 regions to pair by specifying sequential numbers with the -FORCe parameter (-FORCe1=l,m,n ... -FORCe9=x,y,z). • The only allowable base pairs are A-T/U, G-C, and G-T/U. Attempts to force other base pairing produce undefined results
Prevent Folding • -PREVent1=i,j,k ... -PREVent9=x,y,z • prevents the helix that begins with the base pair between bases i and j and extends for k bases to the base pair between bases i+k-1 and j-k+1. • If j is 0, then the sequence of k consecutive bases, beginning at base i is prevented from participating in any helix, forcing them to remain single-stranded. • You can prevent up to 9 regions from pairing by specifying sequential numbers with the -PREVent parameter (-PREVent1=l,m,n ... -PREVent9=x,y,z).
analyze% mfold -check MFold predicts optimal and suboptimal secondary structures for an RNA molecule using the most recent energy minimization method of Zuker. Minimal Syntax: % mfold [-INfile=]alucons.seq -Default Prompted Parameters: -BEGin=1 -END=290 range of interest [-OUTfile=]alucons.mfold energy matrix output file Local Data Files: -DATa1=dangle.mfold037 energies for single base stacking -DATa2=loop.mfold037 destabilizing energies for internal, bulge, and hairpin loops -DATa3=stack.mfold037 energies for base stacking -DATa4=tstack.mfold037 energies for terminal mismatched pairs in interior and hairpin loops -DATa5=tloop.mfold037 bonus energies for recognized "tetraloops" -DATa6=miscloop.mfold037 energies for multi-branched and asymmetric interior loops
Optional Parameters: -DNA folds a DNA molecule -CIRcular folds a circular molecule -TEMperature=37.0 sets the folding temperature (Celsius) -EXTension=mfoldr037 sets the default extension for all local data files -MAXLoopsize=30 sets the maximum size of interior loop -LOPsidedness=30 sets the maximum lopsidedness of an interior loop -FORCe=i,j,k forces k consecutive base pairs, starting with the base pair between i and j -FORCe=i,0,k forces k consecutive bases, beginning with i, to form base pairs -PREVent=i,j,k prevents k consecutive bases pairs, starting with the base pair between i and j -PREVent=i,0,k prevents k consecutive bases, beginning with i, from base pairing -CLOSedexcise=i,j excludes bases i+1 through j-1 from folding, forcing a base pair between i and j -OPENexcise=i,j excludes bases i through j from folding, ligating bases i-1 and j+1 together -NOMONitor suppresses screen trace of program progress -NOSUMmary suppresses screen summary at the end of the program -BATch submits program to the batch queue
(Linear) MFOLD what sequence ? bbv2.seq Begin (* 1 *) ? End (* 334 *) ? What should I call the energy matrix output file (* bbv2.mfold *) ? Folding ............................................................ ...... CPU time: 01:21.36 Output file: bbv2.mfold
PlotFold • Plot the optimal and suboptimal structures predicted by MFold • Representation of all secondary structures • Representation of a sampling of secondary structures
analyze% plotfold -check mcvsatrn5.mfold PlotFold displays the optimal and suboptimal secondary structures for an RNA molecule predicted by MFold. Minimal Syntax: % plotfold [-INfile=]alucons.mfold -Default Prompted Parameters: -MENu=A energy dotplot B p-num plot C circles plot D domes plot E mountains plot F squiggles plot G text output H connect file output
Energy Dotplot (A) Prompted Parameters: -INCrement=5.7 energy increment at which to plot base pairs -LEVels=1 color levels of suboptimality -DENsity=331.82 number of bases per 100 platen units Optional Parameters: -NOCAPtion suppress the caption -NOLABels suppress all labels except for ticks -TICKNUMbering=bc where to place tick numbering (only with -NOLABels) a=bottom b=right c=top d=left -TICKAXes connect ticks with a solid axis -POIntcolor=1 set color for the points -SYMbol=0 set symbol to be plotted (points by default) -SYMBOLHeight=0.18 set height of centered symbols in platen units -DOTSonly suppress connect adjacent points with a line -NOAXis suppress drawing an axis of symmetry
P-Num Plot (B) Prompted Parameters: -INCrement=5.7 energy increment at which to plot base pairs -DENsity=252.2 number of bases per 100 platen units
Circles Plot (C) Prompted Parameters: -INCrement=5.7 energy increment to plot secondary structures -LIStsize=25 maximum number of structures to display -WINdow=5 minimum "distance" between any plotted foldings -ANGleperbase=1.2241 degrees of arc given to each base -RADius=45.0 radius of circle Optional Parameters: -SHOwseq show the sequence in the plot -NUMbering[=10] display sequence numbers every 10th base -NOTICks suppress the ticks and their numbers -CHOrds connect paired bases with chords instead of arcs
Domes Plot (D) Prompted Parameters: -INCrement=5.7 energy increment at which to plot secondary structures -LIStsize=25 maximum number of structures to display -WINdow=5 minimum "distance" between any plotted foldings Optional Parameters: -SHOwseq show the sequence in the plot -NUMbering[=10] display sequence numbers every 10th base -NOTICks suppress the ticks and their numbers -DENsity=207.14 sets the number of bases per 100 platen units -MINortomajor=0.8 ratio between the axes of the ellipse -RECtangles plot rectangle instead of ellipses -PEAks plot diamond peaks instead of ellipses
Mountains Plot (E) Prompted Parameters: -INCrement=5.7 energy increment at which to plot secondary structures -DENsity=331.82 number of bases per 100 platen units -LIStsize=25 maximum number of structures to display -WINdow=5 minimum "distance" between any plotted foldings Optional Parameters: -SHOwseq show the sequence in the plot -NUMbering[=10] display sequence numbers every 10th base -NOTICks suppress the ticks and their numbers -STEMdepth=45 number of stems on the Y axis of each page
Squiggles Plot (F) Prompted Parameters: -INCrement=5.7 energy increment at which to plot secondary structures -LIStsize=25 maximum number of structures to display -WINdow=5 minimum "distance" between any plotted foldings Optional Parameters: -SHOwseq show the sequence in the plot -SHOwseq[=32,45] specify a range of the sequence to be shown -SEQHeight=0.9 height for sequence display and numbering -NUMbering[=10] display sequence numbers every 10th base -PIVot=i,j,theta pivot the substructure beginning at i and ending at j theta degrees
Text Output (G) Prompted Parameters: -INCrement=5.7 energy increment at which to plot secondary structures -LIStsize=25 maximum number of structures to display -WINdow=5 minimum "distance" between any plotted foldings Optional Parameters: -LINesize=80 sets the number of characters per line
Connect File Output (H) Prompted Parameters: -INCrement=5.7 energy increment at which to save secondary structures -LIStsize=25 maximum number of structures to save -WINdow=5 minimum "distance" between any saved foldings
Add what to the command line ? Process set to plot with COLORWORKSTATION attached to GCG_Graphics using the xwindows graphic interface. Maximum size of interior loop = 30 Maximum lopsidedness of an interior loop = 30 Do you want to display: SURVEY OF OPTIMAL AND SUBOPTIMAL FOLDINGS A) energy dotplot B) p-num plot SAMPLING OF OPTIMAL AND SUBOPTIMAL FOLDINGS C) circles D) domes E) mountains F) squiggles G) text output H) connect file output Please choose one (* A *): b
Energy of optimal structure = -84.2 Plot base pairs at what energy increment (* 4.2 *) ? The minimum density for a one page plot is: 290.4 bases/100 platen units What density would you like (* 290.4 *) ? The p-num plot will take 1 pages. Would you like to: P)lot the statistics D)ifferent density Q)uit Please select one (* P *):
Energy Dotplot • Shows a representation of all predicted base pairings in all structures as a Dotplot • Dots represent base pairings within a defined energy increment • Color can be used to represent different energy increments • Black is optimal
P-Num Plot • Graphs the amount of variability at each position • Shows how many different base pairing partners are predicted across all structures for a particular base
Text Representation of Folding • bbv2.fld.txt
Structure Plots • Displays a sampling of structures using the specified output format • Squiggles • Circles • Domes • Mountains • Text • Connect file
Structure Samples • Displays structures within a defined energy increment • Displays as many different structures within the given energy increment as you wish • only if they exist
StemLoop • Finds Inverted Repeats • Set StemLength • Minimum Bonds/Stem (Stringency in DotPlot) • GC = 3 • AU = 2 • GU = 1 • Maximum Loop Size • Minimum Loop Size
analyze% stemloop -check StemLoop finds stems (inverted repeats) within a sequence. You specify the minimum stem length, minimum and maximum loop sizes, and the minimum number of bonds per stem. All loops or only the best loops can be displayed on your screen or written into a file. Minimal Syntax: % stemloop [-INfile=]Vi:Mcvsatrn5 -Default Prompted Parameters: -BEGin=1 -END=334 range of interest -STEMlength=6 minimum stem length -BONds=12 minimum bonds per stem -MINLoopsize=3 minimum loop size -MAXLoopsize=20 maximum loop size (distance to furthest inverted repeat) -MENu1=1 output: See stems=1, See coordinates=2, File=3, DotPlot file=4 -MENu2=1 sort by: Position=1, Quality=2, Size=3 -MAXSTems=25 maximum number of stems to show (quality or size sorts only) [-OUTfile=]Mcvsatrn5.stem output file name
Local Data Files: -MATRix=stemloop.cmp scoring matrix for finding bonds-stem !!NA_SCORING_MATRIX_RECT 1.0 Default scoring matrix used by STEMLOOP for the comparison of nucleic acid sequences. The match value for any comparison is related to the number of bonds formed between the paired nucleotides. February 20, 1996 14:35 .. A C G T U A 0 0 0 2 2 C 0 0 3 0 0 G 0 3 0 1 1 T 2 0 1 0 0 U 2 0 1 0 0