Download
1 / 24
240 likes | 353 Vues
This analysis, presented by Dr. Babar T. Shaikh from The Aga Khan University, Karachi, delves into the state of epidemiological transition in Pakistan. It highlights key statistics including population distribution, health indicators, and socio-economic factors impacting public health. With a population of over 150 million, the study elaborates on maternal health, childhood mortality, and the challenges faced in health expenditure. This comprehensive overview aims to inform healthcare policies and initiatives aimed at improving health outcomes in the region.

E N D
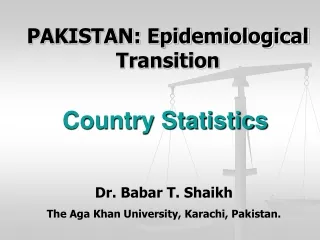
Country Statistics PAKISTAN: Epidemiological Transition Dr. Babar T. Shaikh The Aga Khan University, Karachi, Pakistan.
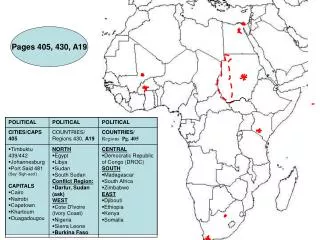
CENTRAL ASIA CHINA Kashmir AFGHANISTAN IRAN INDIA ARABIAN SEA
Countries ranked by Population 2003 Rank Country Population 1 China 1,286,975,468 2 India 1,049,700,118 3 United States 290,342,554 4 Indonesia 234,893,453 5 Brazil 182,032,604 6 Pakistan 150,694,740 7 Russia 144,526,278 8 Bangladesh 138,448,210 9 Nigeria 133,881,703 10 Japan 127,214,499
Basic Indicators Total Population 150,694 (000s) Population under 5 23793 Population under 18 73691 Annual no. of births 5349 GNP per Capita (US$) 470
Education Adult Literacy Rate Male59 Female 33 Primary School Enrolment Ratio Male 84 Female 60 Secondary School Enrolment Ratio Male 33x Female 17x
% of population with access to safe water Water – Total 88 Water – Urban 96 Water – Rural 84 % of population with access to adequate sanitation Sanitation – Total 61 Sanitation – Urban 94 Sanitation – Rural 42 Water and Sanitation
Immunization % fully immunized (1-year-old children) BCG 73DPT3 58Polio3 58Measles 54TT2 51 % of routine EPI vaccines financed by government: 100
Demographic Indicators IndicatorValueData UnitYearSource Population Growth Rate 2.1 % 2001 1 Percent Urban 36.5 % 1999 2 Life Expectancy at Birth 61.5 2001 1 Crude Birth Rate 31.2 per 1,000 2001 1 Crude Death Rate 9.3 per 1,000 2001 1 Number of Live Births 4,513 000s 2001 1
Life Expectancy at birth (years) Both sexes 61.3 Males 61.0 (59.4 – 62.5) Females 61.5 (59.7 - 63.2)
Socio-economic Indicators Indicator Value Data Unit Year Source GNI per Capita (PPP) 1,860 $ 1999 1 Health Expenditure as percentage of GDP 4.0 % 1990-98 1 Physicians per 1,000 People 0.6 1990-98 1 Adult Literacy Rate 45.0 % 1999 1 Adult Literacy Rate, Female 33.0 % 1999 1 Adult Literacy Rate, Male 58.9 % 1999 1
Family Planning Indicators Indicator Value Data Unit Year Source Total Fertility Rate 4.4 2001 1 Total Fertility Rate 4.9 1990 2 Contraceptive Prevalence Rate, Modern Methods, All Women 8.7 % 1990 2 Contraceptive Prevalence Rate, Modern Methods, Married Women 12.6 % 1994 3 Mean Ideal Family Size 4.1 1990 2 Women 20-24 Who Gave Birth before age 20 30.5 % 1990 2
Maternal Health Indicators Indicator ValueData Unit Year Source Maternal Mortality Ratio 201 /100,000 live births 1995 1 Antenatal Care (at least 1 visit) 28.8 % 1990 2 Antenatal Care (2+ visits) 23.5 % 1990 2 Antenatal Care (4+ visits) 14.2 % 1990 2 Assisted Delivery by a Health Professional 18.6 % 1990 2 Assisted Delivery by Doctor 12.3 % 1990 2 Assisted Delivery by Other Health Professional 6.3 % 1990 2
Child Survival Indicators Indicator Value Data Unit Year Source ARI Treatment – Children Under 5 66.3% 1990 1 ORT Use Rate 44.9 % 1990 1 Mortality Indicators Infant Mortality Rate 79 2002 2 (per 1,000 live births) Females 78 2002 2 Males 79 2002 2 Under-5 Mortality Rate 122 2001 2
Child Survival Indicators II Indicator Value Data Unit Year Source Nutrition Indicators Exclusive Breastfeeding (under 4 mos.)10.5 % 1990 1 Exclusive Breastfeeding (under 6 mos.)10.9 % 1990 1 Stunted (height-for-age)49.6 % 1990 1 Underweight (weight-for-age)40.2 % 1990 1 Wasted (weight-for-height)9.2 % 1990 1
Infant Mortality rates / Under 5 Mortality rates Year Infant Mortality Rate Under 5 Mortality Rate 1985 118 188 1990 106 166 1995 93 144 2000 82 125 2005 73 108 2010 63 93 2015 55 79 2020 47 66
HIV/AIDS Prevention Indicators Indicator Value Data UnitYearSource HIV Prevalence, Adults 0.1 % 1999 1 HIV Prevalence, Females 15-24,0.03-0.06 % 1999 1 HIV Prevalence, Males 15-24, 0.02-0.1 % 1999 1
Infectious Diseases Control Indicators Indicator Value Data UnitYearSource TB Incidence Rate 177 per 100,000 pop 1998 1 Case Detection Rate 5.2 % 1998 1 TB (DOTS) Treatment Success Rate 65.9 % 1998 1 Malaria 82,526 # of cases 2000 2 reported
Estimated Total fertility rate per Woman Year Fertility Rate 1985 6.7 1990 6.2 1995 5.4 2000 4.6 2005 3.8 2010 3.2 2015 2.7 2020 2.4 2025 2.3
Population Projections & Estimates 1980 85,219,117 1990 113,975,232 2000 141,553,775 2010 171,373,158 2020 199,744,808
Health Expenditure Total health expenditure Total expenditure on health as % of GDP, 2000 4.1 Per capita total expenditure on health at average exchange rate (US$), 200018 Per capita total expenditure on health in international dollars, 200076
Health Expenditure II Public health expenditure General Government expenditure on health as % of total expenditure on health, 200022.9 General Government expenditure on health as % of total general government expenditure, 2000 4.0 Per capita government expenditure on health at average exchange rate (US$), 2000 4 Per capita government expenditure on health in international dollars, 200017
Health Expenditure III Sources of public health expenditure Social security expenditure on health as % of general government expenditure on health, 2000 50.0 External resources for health as % of general government expenditure on health, 2000 8.2 Private health expenditure Private expenditure on health as % of total expenditure on health, 200077.1 Sources of private health expenditure Prepaid plans as % of private expenditure on health, 2000 0 Out-of-pocket expenditure on health as % of total expenditure on health, 2000 77.1