Download
1 / 20
200 likes | 295 Vues
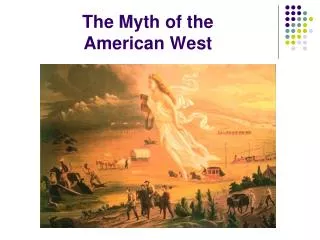
This paper explores the migration patterns in the American West post-1890, analyzing net migration, internal migration trends, and the influence of immigrant settlement. Using data from the 1970-2000 censuses, the study provides insights into the impact of foreign-born immigration on native-born population movements.

E N D
The Closing of the American West by Michael J. Greenwood University of Colorado at Boulder and Jesse Sexton University of Colorado at Boulder
Based on 1890 census returns, Robert P. Porter, Superintendent of Census (1891), declared the frontier closed: "Up to and including 1880 the country had a frontier of settlement, but at the present the unsettled area has been so broken into isolated bodies of settlement that there can hardly be said to be a frontier line. In the discussion of its extent, its westward movement, etc., it can not, therefore, any longer have a place in the census reports."
Following this pronouncement and building on it, in 1893 Frederick Jackson Turner (1893, p. 199) expressed his well-known thesis regarding the importance of the frontier in American history: "Up to our own day American history has been in a large degree the history of the colonization of the Great West. The existence of an area of free land, its continuous recession, and the advance of American settlement westward, explain American development."
However, after 1890 one important aspect of the frontier remained--people continued moving west. It was not until 100 years later, during the 1990s, that net migration to the West ceased. Why? That is the question addressed in this paper.
The 2009 CPS distinguishes annual net internal migration for 2008-2009 for the native born and the foreign born. For this year, the West experienced positive net migration of 20,000 with 50,000 net foreign-born persons entering the West from other U.S. regions, but 30,000 net native-born persons departing the West. This observation, along with the persistent finding that immigrants have a strong tendency to settle in areas with co-ethnics, has caused us to focus on the foreign born and to distinguish between the native born and the foreign born in the analysis that follows.
Frey and Liaw (2005): "Our results generally show no race-specific flight of whites alone from (states with large numbers of low-skilled immigrants), but rather show an accentuated out-migration of all race-ethnic groups from states with ... high levels of foreign-born immigration" (p. 246, parentheses ours). Moreover, they find that "for every 100 new low-skilled immigrants to California there would be a net out-migration of fifty-one low-skilled domestic migrants" (p. 213).
Collins (1997) shows convincingly that during the late 19th and early 20th centuries, when immigration to northern cities ebbed, migration from South to North flowed, whereas when immigrant settlement in these cities surged, northward migration ebbed. Thus, historically, broad regional growth patterns were significantly affected by immigration and by immigration settlement patterns.
Much the same has been found with respect to internal migration in the U.S. For example, Fishback and Kantor (2010) find that during The Great Depression for U.S. cities For every 10 arriving migrants: • 1.9 people moved out • 2.1 did not get a relief job, and • 1.9 shifted from full-time to part-time work.
Data State-to-state migration data (for the coterminous states) for the native born and the foreign born were generated from the Public Use Microdata Samples (IPUMS) of the 1970, 1980, 1990, and 2000 Censuses.
We transform the respective migration flows into rates by dividing by the group-specific at-risk to migrate population of the origin state. The at-risk population is the population at the end of the migration interval plus out-migrants minus in-migrants. The total number of observations for each year is 2,256.
An issue with which we must deal is zeros in the dependent variable. For the native born, we have no measured flow between the following numbers of states: 46, 16, 6, and 6 for 1965-70, 1975-80, 1985-90, and 1995-2000, respectively. The respective numbers are somewhat higher for the foreign born: 788, 488, 258, and 188. The zeros constitute an issue.
A common approach to dealing with the problem of zeros in the dependent variable and the approach we adopt is to estimate a Tobit regression (Tobin, 1958). However, we also stack the data and estimate the Tobits in the context of seemingly unrelated regression (SUTR) because the errors are likely to be correlated for the natives and the foreign born in any given period (Zellner, 1962). The SUTRs are estimated in two ways.
Table 5 Interact FB with West also interact FB with South 1975-80 and 1995-00 (not 1985-90): high FB concentrations cause natives to depart the West. 1985-90 and 1995-00: High FB concentrations attract natives to both the West and South. Major difference: Higher Hispanic shares attract both natives and the foreign born to the South but are never important for the West.
Table 6 Break California out of West 1995-00 (not 1985-90): California becomes a less desirable destination for both natives and the foreign born. So does the non-California West, but not as much as California and only for natives.
Table 7 Interact employment growth with FB concentration and Hispanic share Neither variable much affected the attractiveness of jobs, except that they made jobs more attractive during 1995-00 for both groups of migrants..
Conclusions In this paper we have estimated modified gravity models of interstate migration for four periods (1965-1970, 1975-1980, 1985-1990, and 1995-2000) in an effort to determine why net migration to the West has ceased after decades of heavy net in-migration. Building on the earlier work of others that shows a strong migration response of the native born to the location of the foreign born, we specifically distinguish internal movements of the native born and the foreign born. California appears to play a critical role. During the 1990s for the first time in many years, if not ever, California became a less desirable destination for each group with the foreign born evading this state even more than the native born. Many factors not accounted for in our models could be responsible for this change--factors such as high housing prices, high taxes, congestion, and more.
Concentrations of the foreign born appear to have played some role in encouraging out-migration from the West (and the South) but this was not an especially powerful role and for the most part the influence was important only during the 1990s, which may account in part for the closing of the West. Among the foreign born in the West, the presence of Hispanics was never especially important.