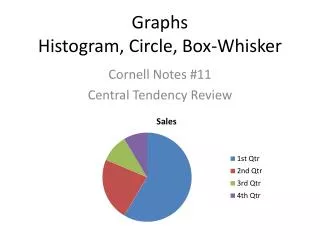
Module 5 Box, Dot, Histogram, Strip Charts
140 likes | 322 Vues
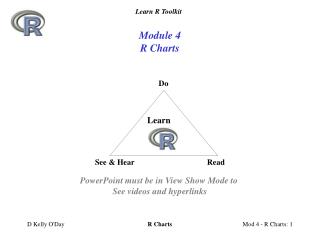
Module 5 Box, Dot, Histogram, Strip Charts. Do. Learn. See & Hear. Read. PowerPoint must be in View Show Mode to See videos and hyperlinks. Module 5 Box, Dot, Histogram, Strip Charts. Do. Learn. See & Hear. Read. Making Box, Dot, Histogram, Strip Charts.

Module 5 Box, Dot, Histogram, Strip Charts
E N D
Presentation Transcript
Module 5Box, Dot, Histogram, Strip Charts Do Learn See & Hear Read PowerPoint must be in View Show Mode to See videos and hyperlinks Box, Dot, Histogram , Strip Charts
Module 5Box, Dot, Histogram, Strip Charts Do Learn See & Hear Read Box, Dot, Histogram , Strip Charts
Making Box, Dot, Histogram, Strip Charts Click video image to start video Box, Dot, Histogram , Strip Charts
Menu Overview of R ChartingHigh Level Plot Functions Arguments Produce complete chart Box, Dot, Histogram , Strip Charts
Box Plot Dot Plot Histogram Strip Chart Module 5 Box, Dot, Histogram, Strip ChartsMenu Box, Dot, Histogram , Strip Charts
Menu Making a Box & Whisker Plot withboxplot() Function boxplot() boxplot(?? ~ ??, data = ??, col = “??", horizontal = ??, par(cex = 0.??),whisklty=??, outline = ??, boxcol = “??", boxwex = ??, border = “??", pch = ??, outcol = “??, main = ??) Data File: C:\\Learn_R\\Mod_4_R_Charts\\iris_data.txt "Sepal.L","Sepal.W","Petal.L","Petal.W","Species"5.1,3.5,1.4,0.2,"setosa“4.9,3,1.4,0.2,"setosa“4.7,3.2,1.3,0.2,"setosa“4.6,3.1,1.5,0.2,"setosa“5,3.6,1.4,0.2,"setosa“5.4,3.9,1.7,0.4,"setosa" boxplot(Sepal.W ~ Species, data = my_data, col = "grey", horizontal = FALSE, par(cex = 0.7),whisklty=1, outline = TRUE, boxcol = "grey", boxwex = 0.5, border = "darkgrey", pch = 16, outcol = "red", main = Title) R’s Iris flower data set copied to text file Box, Dot, Histogram , Strip Charts
Box plot with All Points • R lets you add low level graphics to a plot • Show all points on box plot boxplot(Sepal.L ~ Species, data = my_data, col = "blue", horizontal = FALSE, par(cex = 0.65),whisklty=1, outline = TRUE, boxfill = "grey", boxwex = 0.5, border = "darkgrey", pch = 16, outcex = 1.25, outcol = "red", main = Title) points(my_data$Sepal.L~my_data$Species, pch=16, col="red") Box, Dot, Histogram , Strip Charts
Make your own box plot like this Notice horizontal orientation, line style and blue color Menu Assignment 5-1Make a Box plot #################### Box_plot_assign.R ################### ##Script to produce assignment box plot ## STEP 1: SETUP & Source File rm(list=ls()) oldpar<- par(no.readonly=T) par(las=1); par(oma=c(2,4,0,2)); par(mar=c(3,3,3,1)) script <- "C:/Learn_R/Mod_5_box_dot_hist_charts/Practice_5_1_Bo link <- "C:\\Learn_R\\Mod_5_Box_Dot_Hist_Charts\\iris_data.txt" ## STEP 2: READ DATA my_data <- read.table(link, sep = ",", dec=".", skip = 0, row.names = NULL, header = TRUE, colClasses = c(rep("numeric", 4), "factor"), na.strings = c("", "*", "-", -99.99,99.9, 999.9)) ## STEP 3: MANIPULATE DATA Title <- "Iris Flower Data Set: Petal Length" ## STEP 4: CREATE PLOT boxplot(Petal.L ~ Species, data = my_data, col = "blue", horizontal = TRUE, cex = 0.65,whisklty=5, outline = TRUE, boxcol = "grey", boxwex = 0.5, border = "darkgrey", pch = 16, outcex = 1., outcol = "red", main = Title) ## Outer margin annotation my_date <- format(Sys.time(), "%m/%d/%y") mtext(script, side = 1, line = .5, cex=0.7, outer = T, adj = 0) mtext(my_date, side = 1, line =.5, cex = 0.7, outer = T, adj = 1) ## STEP 5: CLOSE par(oldpar) Box, Dot, Histogram , Strip Charts
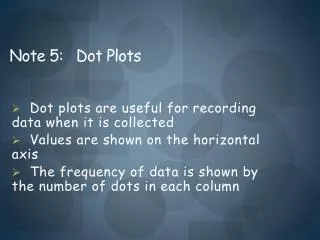
Dot plots developed by William Cleveland Alternative to bar charts X axis displays measurement Y axis displays categorical label Menu Making a Dot Plot with dotchart() Function Data File:C:\Learn_R\Mod_5_Box_Dot_Hist_Charts\dot_plot_data.txt Dotchart()dotchart(??, labels = ??, groups = ??, main = “??", xlab = "??", pch = ??, col = "??", lcolor = ??, gcolor = ??) Box, Dot, Histogram , Strip Charts
Menu Dot Plot ScriptsSimple & Grouped Simple Dot Plot Grouped Dot Plot dotchart(Quad_BTU, labels = Fuel, groups = Type, main = Title, xlab = "Quadrillion BTU", pch = 16, col = "blue", lcolor = NULL, gcolor = “red“ ) text(5,0.5, cex=0.65, pos=4, Source) dotchart(Quad_BTU, labels = Fuel, main = Title, xlab = "Quadrillion BTU", pch = 16, col = "blue", lcolor = NULL) text(5,0.5, cex=0.65, pos=4, Source) Box, Dot, Histogram , Strip Charts
Start with script C:/Learn_R/Mod_5_Box_Dot_Hist_Charts/Dot_plot_Simple_example.R Make your own dot plot like this Use dot_plot_data.txt for source data Notice Y axis grid lines with grey color Menu Assignment 5-2 Dot Plot dotchart(Quad_BTU, labels = Fuel, main = Title, cex = 0.7, xlab = "Quadrillion BTU", pch = 16, col = "blue", lcolor = NULL) text(5,0.5, cex=0.65, pos=4, Source) grid(nx=0, ny=10,col = "grey") Box, Dot, Histogram , Strip Charts
Menu Making a Histogram with hist() Function hist(my_scores, freq = T, breaks = 10,border="black", labels=T, xlim = c(8, 20), ylim = c(0,12), col = "darkgrey", xlab = "Exam Score", ylab= "Number of Students",cex.main=t_par, main = "Histogram of Exam Results: \n Score out of possible 20 points") axis(1, at=seq(8, 20, 1)) Box, Dot, Histogram , Strip Charts
Menu Making a Histogram with hist() Function • Enhancing a histogram: • Histogram w/ counts • Distribution • Median line • Counts <> Median • Summary Stats in Note Box, Dot, Histogram , Strip Charts
Making a Strip Chart with stripchart() Function stripchart(Sepal.L ~ Species, data = my_data, col = "grey", main = Title, font.main=2, vertical = T, pch = 16, font.axis = 1,cex=1., cex.main = 1.2, cex.axis = 1.1) Box, Dot, Histogram , Strip Charts