Download
1 / 19
190 likes | 327 Vues
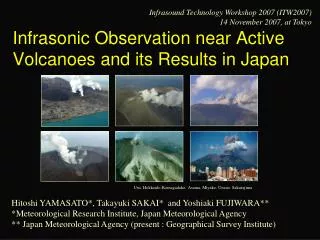
Infrasound Technology Workshop 2007 (ITW2007) 14 November 2007, at Tokyo. Infrasonic Observation near Active Volcanoes and its Results in Japan. Usu, Hokkaido-Komagadake, Asama, Miyake, Unzen, Sakurajima. Hitoshi YAMASATO*, Takayuki SAKAI* and Yoshiaki FUJIWARA**

E N D
Infrasound Technology Workshop 2007 (ITW2007)14 November 2007, at Tokyo Infrasonic Observation near Active Volcanoes and its Results in Japan Usu, Hokkaido-Komagadake, Asama, Miyake, Unzen, Sakurajima Hitoshi YAMASATO*, Takayuki SAKAI* and Yoshiaki FUJIWARA** *Meteorological Research Institute, Japan Meteorological Agency** Japan Meteorological Agency (present : Geographical Survey Institute)
Volcano Observation of JMA Real-time telemeter Tiltmeter 傾斜計 Volcano Observation andInformation Centers (Sapporo, Sendai, Tokyo, Fukuoka) Mobile Observation(Thermal, Geodetic,Geomagnetic etc.) GPS InfrasonicMicrophone High-sensitive Visual Camera Seismometer
Detected infrasounds by JMA Tokachi② Infrasonic Observation of JMA Infrasonic microphone:ACO type7144/3348 Response : 0.1-1000Hz, 70-150dB Telemeter : 100Hz, 12-16bit Usu② Meakan Tarumae Hokkaido-Komagadake③ Iwatesan Nasu Kusatsu-Shirane Adatara Asama③ Aduma 1983- Sakurajima 1989- Tokachidake 1991- Unzen 1996- Aso etc. 2000- Usu, Miyake etc. 2001- Suwanosejima etc. 2006- Fuji Ontake Aso③ Bandai③ Izu-Tobu Unzen② Izu-Oshima③ Kirishima② Fuji Miyakejima⑧ Satsuma-Iojima Kuju Sakurajima⑤ Kuchinoerabujima Suwanosejima Active volcanoes in Japan and infrasonic stations of JMA (as of 2007). Encircled figures represent the number of microphones.
Infrasonic Observation at Sakurajima Typical seismic and infrasonic signal from an explosive eruption at Sakurajima volcano. Monthly number of explosions at Sakurajima. Narita Aviation Weather Center VOIC An example of C type (harmonic) tremor, infrasonic signals and their spectra. (Sakai et al., 1996) Tokyo VAAC VAA
Results at Unzen 1991-95 eruption Nov. 1990 Phreatic eruption May 1991 Lava dome and PFs -1995 Infrasonic observation by JMA 1 station (1991-) 4 station (1992-) Dome collapse Pyroclastic flow Low frequency earthquake Seismic and infrasonic observation atUnzen volcano by JMA (1992-) ●:seismographs △:infrasonic microphone ◆:visual camera
Dome collapse An example of seismic (left) and infrasonic (right) signals from a dome collapse. SPs are seismograms obtained by short period seismographs. LP is by a long period seismograph. Seismic records are for the vertical component. Infrasonic records were obtained by low frequency microphones. The records are arranged according to the horizontal distance from the source. The phases, A and B, are considered to correspond respectively to the start of dome collapse and to the fall of lava blocks onto the slope. (Yamasato et al., 1993)
Infrasonic signal from pyroclastic flow Dome (Left) An example illustrating the migration of a medium sized pyroclastic flow front and the corresponding seismic and infrasonic signals. (Flow distance=3km) Seismic and infrasonic waves were excited while the pyroclastic flow front ran down the slope. (Right) Source locations of infrasonic sources from pyroclastic flows. after Yamasato (1997; JPE)
Waveform correlation of PF signals C K8(+8s) ●A-course (05:34 May 21, 1993) C K8(+8s) ●B-course (00:38 April 4, 1993) C K8(+8s) ●C-course (10:31 June 22, 1992) Examples of infrasonic signals from pyroclastic flows that ran to different three directions. Good correlations are observed among the waveforms of different stations. The source location of the infrasonic signal can be estimated from the travel time differences of phases in the signal, assuming the sound velocity is 340 m/s and the source is on the ground surface.
Infrasound Energy from PF Energy of the infrasonic waves Energy of the seismic waves Es=CP, P=square sum of the waveform C is calculated using the relation of Es(J)=1.5M+4.8for low frequency earthquakes. Relation between the flow distance and the energy ratio of the infrasonic waves to the seismic waves from pyroclastic flows. Only the pyroclastic flows that flowed eastward (B-course) and have clear infrasonic signals were taken. The flow distances are horizontal ones as observed by Unzendake Weather Station. Purple circles indicate the pyroclastic flows for which the flow fronts were out of the range of the video camera, therefore, those distances might be larger than those shown here. (Yamasato, 1997)
Low frequency earthquakes in the lave dome An example of seismic (left) and infrasonic records from a low frequency earthquake beneath the dome. An infrasonic signal was excited at the time of the earthquake occurrence. Dome Source locations of the infrasonic pulses from low frequency earthquakes (red circles) and dome collapses (crosses). Arrows indicate the direction of pyroclastic flows. The 9-th lobe appeared in Dec. 4. after Yamasato (1998)
Volcanic eruption at Usu, 2000 An example of the infrasonic record. Distribution of infrasonic microphones and source location of infrasonic signals from eruptions at Usu volcano. N-B, K-A, K-B are active craters. (Yamasato et al., 2002) N-B K-A K-B Photo taken from north of the craters.
Sequence of eruptive activity An example of the time-sequence of activity at each crater. (Upper) Sequence since mid-April to May 2000 (Yellow in the left figure) (Lower) Since May to July, 2000 (Blue in the left figure) Numbers and amplitudes of infrasonic signals since mid-April 2000. (Yamasato et al., 2002)
Eruption at Miyake volcano, 2000 Date Plume Infrasonic signal July 8 2000 800 m No observation July 14-15 1,500 m Continuous (8 Pa) Aug. 10 8,000 m Continuous (16 Pa) Aug. 18 14,000 m Continuous (>20 Pa) Aug. 21-29 - Impulsive (8 Pa) Aug. 29 8,000 m Continuous (14 Pa) 2001- <1,000 m Impulsive or continuous (<8 Pa) Infrasonic record in 03h-06h, 29 August 2000 at Miyake volcano
Eruption at Hokkaido-Komagadake, 2000 22:13, 4 September 2000 2x10⁻⁶m 5 Pa 60sec 02:42, 28 October 2000 2x10⁻⁶m 5 Pa 60sec Volcanic tremors and infrasound associated with phreatic eruptions at Hokkaido-Komagadake volcano in 2000.
Relation between Infrasonic and Seismic Amplitude Miyakejima (continuous infrasound and tremor) Height of dense ash plume (m above the caldera) Miyakejima (impulsive infrasound and tremor) Usu (impulsive infrasound) Hokkaido-Komagadake 2000 (continuous infrasound) Relation between seismic and infrasonic amplitudes of signals associated with eruptions during July – September 2000 at Miyakejima. Ash plume height indicated. (Δ=2km for seismic , Δ=4km for infrasonic signals)
Eruption at Asama, 2004 Activity in 2004 1 Sep. 2004 First explosion 15 Sep. Lave cake appeared 16-17 Sep. Successive eruptions 23 Sep., 29 Sep., 10 Oct.,14 Nov. Explosions ↓Onset of explosion-quake +10s 200Pa 20:02, 1 Sep. 2004 8Pa >30Hz 80Pa 19:44, 23 Sep. 2004 40Pa 12:17, 29 Sep. 2004 23:10, 10 Oct. 2004 40Pa 80Pa 20:59, 14 Nov. 2004 10s 1min Infrasonic records from explosions at Asama in 2004.The station is 8 km distant of the summit crater. Infrasonic records from Successive eruptions.
Infrasonic wave propagating far away Asama (a) Amplitude of infrasonic signal from an explosion of Asama, 20:02, 1 September 2004. Infrasonic records from an explosion of Asama, 20:02, 1 September 2004. Distribution of infrasonic microphones of JMA Red triangles indicate ones that detected the infrasonic signal excited by explosions of Asama, 20:02, 1 September 2004 (a) and 19:44, 23 September 2004 (b). (b)
Summary Detection of volcanic eruptions and the sequence of eruptive activities Explosive infrasonic pulses (Sakurajima, Usu etc.) Continuous infrasonic waves (Miyake etc.) Determination of source locations using infrasonic network Locations of dome collapses and pyroclastic flows (Unzen) Identification of activities in plural craters (Usu) Scaling / classification of magnitudes / styles of volcanic eruptions