1 / 4

Supplemental figure 1

Supplemental figure 1. 1a). 1b). Supplemental figure 2. S2a. NTDLN. TDLN. SPLEEN. TUMOR. S2b. D7. D14. CD25. D21. D28. CD19. Supplemental figure 3. (3a). (3b). PCR genotype. ELISA-LPS stimulation. -/-. -/-. +/+. +/+. Supplemental figure 4. % Lysis. E:T ratio.

seamus
Télécharger la présentation

Supplemental figure 1

An Image/Link below is provided (as is) to download presentation Download Policy: Content on the Website is provided to you AS IS for your information and personal use and may not be sold / licensed / shared on other websites without getting consent from its author. Content is provided to you AS IS for your information and personal use only. Download presentation by click this link. While downloading, if for some reason you are not able to download a presentation, the publisher may have deleted the file from their server. During download, if you can't get a presentation, the file might be deleted by the publisher.

E N D

Presentation Transcript


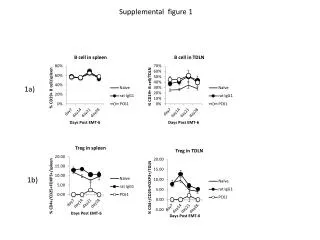
  1. Supplemental figure 1 1a) 1b)

  2. Supplemental figure 2 S2a NTDLN TDLN SPLEEN TUMOR S2b D7 D14 CD25 D21 D28 CD19

  3. Supplemental figure 3 (3a) (3b) PCR genotype ELISA-LPS stimulation -/- -/- +/+ +/+

  4. Supplemental figure 4 % Lysis E:T ratio

More Related