Assignment
Assignment. This week: Collect data for use in discussion group Follow the CITI ethics standards Non-intrusive / coercive Anonymous Sensitivity Do not sample sensitive populations Sensitive topics: (schizophrenia, criminals…) ask about the topic….

Assignment
E N D
Presentation Transcript
Assignment This week: • Collect data for use in discussion group • Follow the CITI ethics standards • Non-intrusive / coercive • Anonymous • Sensitivity • Do not sample sensitive populations • Sensitive topics: (schizophrenia, criminals…)ask about the topic… Please go to “Slide Show” and click “Play slide show” to get the animations for these lectures. Survey research
Psychology 242, Dr. McKirnan. Survey research 3/10/14 • Topic areas & formats • Testing Hypotheses • General issues in Survey research • Sources of bias (or fraud…) • Examples of surveys Survey research
Psychology 242, Dr. McKirnan. Survey research 3/10/14 • Topic areas & formats • Testing Hypotheses • General issues in Survey research • Sources of bias (or fraud…) • Examples of surveys Survey research
What do surveys measure? • Knowledge • Information re: current events, political or consumer choices • Awareness of Public health resources, health practices, etc. • Attitudes and Beliefs • Preferences or evaluations: e.g., attitudes toward gays, ethnic groups, etc., consumer preferences. • Beliefs about political or social events: “which party provides the strongest security for the U.S….?” • Feelings or moods: quality of life, depression / anxiety, marital satisfaction, etc. • Behavior • Behavioral intentions; Intent to vote, financial plans, etc. • Self-reportsof previous or on-going behavior; topics range from voting to alcohol and drug use. Survey research
Survey research;General uses of surveys • Descriptive • Epidemiology; e.g.,drug use surveys, diet surveys • Political / social description; e.g.,opinion polls • Test hypothesis • Assess blocking variables: e.g., gender differences in political / social attitude. • Correlational studies;e.g., correlates of dieting… • Examine generalizability of experimental results • E.g., Consumer reports survey on therapy • Predict event or outcome; • E.g., election polling • Pragmatic / applied, • E.g., marketing, or consumer surveys. Survey research
Surveys; populations • Who do we want to generalize to ? • Our sampling frame is based on our hypothesis or empirical question. • Sampling: breadth internal validity tradeoff • Key dimensions: • Demographic • ethnic / age / gender groups, • “all Americans”… • Behavioral • “likely voters”, alcohol users, home buyers... • Self-identification • Republicans / Democrats, • “students”… See Design and sampling overview See also: diminishing validity of political polling. Survey research
Question Formats: Closed-ended items • Specific rating scale or highly structured prompts • Most reliable for concrete behaviors • An attitude can be assessed in several ways: • Direct (face valid) assessment Does not 1 2 3 4 5 6 7 strongly agree at all agree Psychology 242 is a wonderful course… • Behavioral (content valid) indictors 0 How many times this semester have you skipped 242 class? ______ How many hours per day do you spend reading 242 material? ______ 2.5 Researchers typically use the M of several related items to create a more reliable measure of a variable. Survey research
Sum of item ratings / 9 “Closed-ended” items, cont. • Example: CES-D Depression inventory: • We may use the Mscore of these 9 items as our depression index… Moods & Feelings Below is a list of different feelings. Circle the number that shows howmanydaysyou felt each of these over the PAST WEEK. Rarely or A Little A moderate Most or all of none of of the Time amount of the time the time the time (less than 1 day) (1 or 2 days) (3 - 4 days) (5 - 7 days) I was bothered by things that usually do 0 1 2 3 not bother me. I felt I could not shake off the blues even 0 1 2 3 with help from my friends or family. I had trouble keeping my mind on what 0 1 2 3 I was doing. I felt depressed. 0 1 2 3 I felt that everything I did was an effort. 0 1 2 3 My sleep was restless. 0 1 2 3 I was happy. 0 1 2 3 I enjoyed life. 0 1 2 3 I felt sad. 0 1 2 3
# of symptoms: items rated 2 or 3 “Closed-ended” items, cont. • Or we may count the number of symptoms • We may have a cut point: e.g., moderate depression is defined as 4+ symptoms Moods & Feelings Below is a list of different feelings. Circle the number that shows howmanydaysyou felt each of these over the PAST WEEK. Rarely or A Little A moderate Most or all of none of of the Time amount of the time the time the time (less than 1 day) (1 or 2 days) (3 - 4 days) (5 - 7 days) I was bothered by things that usually do 0 1 2 3 not bother me. I felt I could not shake off the blues even 0 1 2 3 with help from my friends or family. I had trouble keeping my mind on what 0 1 2 3 I was doing. I felt depressed. 0 1 2 3 I felt that everything I did was an effort. 0 1 2 3 My sleep was restless. 0 1 2 3 I was happy. 0 1 2 3 I enjoyed life. 0 1 2 3 I felt sad. 0 1 2 3
Closed-ended items, summary • Chief virtue: clear operationalization • Specific & concrete; we know exactly what the participant is responding to • Easy to quantify & use statistically • Can be tested for reliability • Chief liability: potential insensitivity • Brief& simply worded; potentially superficial • “Top down”; issues are imposed on the participant • Discrimination studies: no option for “has no attitude” • Attitudes / moods: not sensitive to participants’ personal perspectives (?). Survey research
Survey formats; “Open-ended” items General textual / qualitative response; More sensitive to the respondent How have you enjoyed your methods class so far? Please list the three things that first come to mind when you think of Psychology 242. • More difficult to interpret • Can be analyzed as qualitative data(see discussion in Descriptive data.) • Can be quantified; • frequency counts of citations or statements • “linkages” analysis of co-occurring statements • Often presented as textual portrayal plus minor quantitative analysis. Survey research
Example of mixed survey formats Closed-ended attitude scale Open-ended description Simple behavioral index. Example of mixed question format from survey of women’s sexual practices. Personal Safer Sex Guidelines How strict are your personal guidelines or rules for safer sex (e.g., condom use, “safe relationships,” etc.)? 1 2 3 4 5 6 7 Not at all Somewhat Very Extremely Strict Strict Strict Strict What are your rules for safer sex? Have you ever refused to have sex 0 1 2 3 with someone to stay safe?Never once or a few many twice times times Survey research
Surveys assess: • Knowledge • Attitudes or preferences • Ongoing or intended behavior • Open-ended formats • Highly structured, easy to analyzed • Potentially insensitive • Closed-ended formats • More sensitive to participant • Potentially ambiguous or difficult to analyze • Surveys typically… • Use multiple items • Employ several formats. Summary Survey research
Psychology 242, Dr. McKirnan. Survey research 3/10/14 • Topic areas & formats • Testing Hypotheses • General issues in Survey research • Sources of bias (or fraud…) • Examples of surveys Survey research
Alcohol: Knowledge 1 What is the chemical in alcohol? a) ethanolb) zymasec) dehydrogenased) nicotine Let’s do our own practice survey! Survey research
Alcohol: Knowledge 2 Which of these drinks contains the least alcohol? A = 12 ounces of beer B = 5 ounces of wine C = 1 1/2 ounces of vodka D = 8 ounces of malt liquor E = All are equal Survey research
Alcohol: Knowledge 3 How long does it take for alcohol to affect the brain? a) 10 secondsb) 90 secondsc) 10 minutesd) 90 minutes Survey research
Alcohol attitudes, 1 Drinking helps me feel whatever way I want to feel. A = agree strongly B = agree C = somewhat agree D = slightly agree E = do not agree Survey research
Alcohol attitudes, 2 Alcohol makes me feel happy. A = agree strongly B = agree C = somewhat agree D = slightly agree E = do not agree Survey research
Alcohol attitudes, 3 Drinking adds a certain warmth to social occasions. A = agree strongly B = agree C = somewhat agree D = slightly agree E = do not agree Survey research
Alcohol behavior, 1 How often do you have a drink containing alcohol? A = never B = monthly or less C = 2 to 4 times a month D = 2 to 3 times a week E = 4 or more times a week Survey research
Alcohol behavior, 2 How many drinks containing alcohol do you have on a typical day when you are drinking? A = 1 B = 2 C = 3 D = 4 or 5 E = 6 or more Survey research
Alcohol behavior, 3 How often during the last year have you found that you were not able to stop drinking once you had started? A = never B = less than monthly C = monthly D = weekly E = daily or almost every day Survey research
Alcohol behavior, 4 How often during the last year have you failed to do what was normally expected from you because of drinking? A = never B = less than monthly C = monthly D = weekly E = daily or almost every day Survey research
Knowledge / attitude / behavior composites Our data set: • Several items assess each Hypothetical Construct. • We also collect demographics (age, gender, ethnicity…) and other Ψ variables. • We choose items based on our Theoryabout alcohol use and problems. • We can simply Describeour data in each category. • We might Blockthe data by important categories of participants • Or we can Test Hypotheses about correlations among variables Knowledge • What is the chemical in alcohol • Which of these drinks contains the least alcohol? • How long does it take for alcohol to affect the brain? Attitudes and beliefs • Drinking helps me feel whatever way I want to feel. • Alcohol makes me feel happy. • Drinking adds a certain warmth to social occasions. Behavior • How often do you have a drink containing alcohol? • How many drinks containing alcohol do you have on a typical day when you are drinking? • How often during the last year have you found that you were not able to stop drinking once you had started? • How often during the last year have you failed to do what was normally expected from you because of drinking? Survey research
Knowledge / attitude / behavior composites Research questions: • How well do the items within each category correlate? • Are they internally Reliable? • Can we construct a Composite Variable from each item set? • Blocking Variables: Gender? Ethnicity? Age?... • What are the Correlations among composite variables? • How much are knowledge or attitudes & beliefs associated with alcohol use? • Are alcohol use and problems correlated? • Are these effects Mediated by other variables? • Do depression, isolation, or stress make people vulnerable to alcohol use or problems? Knowledge • What is the chemical in alcohol • Which of these drinks contains the least alcohol? • How long does it take for alcohol to affect the brain? Attitudes and beliefs • Drinking helps me feel whatever way I want to feel. • Alcohol makes me feel happy. • Drinking adds a certain warmth to social occasions. Behavior • How often do you have a drink containing alcohol? • How many drinks containing alcohol do you have on a typical day when you are drinking? • How often during the last year have you found that you were not able to stop drinking once you had started? • How often during the last year have you failed to do what was normally expected from you because of drinking? Survey research
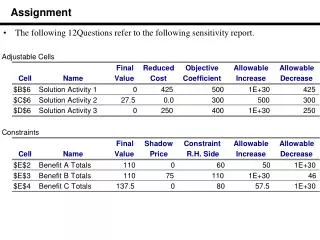
Class data, n = 97 Multiple items assessed the Hypothetical Constructs of Alcohol- related information, attitudes, use, and problems. • Information: # of correct answers for items 1 3. • Attitudes: items 4, 5 & 6. • Use: drinking frequency * # drinks / occasion (items 7 & 8). • Problems: Items 9 & 10. Example Information: Mode = 2 items correct. Survey research
Class survey data, Attitudes • To test weather the 3 attitude items comprised a single Hypothetical Construct, we examine their intercorrelations • All the correlations and high and statistically significant, so we can combine them into a single composite variable. Example Survey research
Class survey data, Attitudes • The frequency distribution for the composite attitude variable shows an approximate normal distribution. • The Mean and Median are equal, near the center of the distribution • The mode reflects a larger block of participants with moderately strong attitudes. Example
Class survey data, Alcohol problems • We perform the same operations for items 9 & 10, the alcohol problems measures. • The correlation between these items is very high. • We can validly combine them into one variable. Example
Class survey data, Alcohol problems • Most people report no problems, as shown in the Mean and Median • The rest of the distribution shows a strong positive skew. • This skew pulls the Mean higher than the Mode & Median. Example
Class survey data, Correlation results • The amount of information people have about alcohol is unrelated to their alcohol use or problems • The correlations are low • Neither is statistically significant. • Positive attitudes toward alcohol are strongly associated with alcohol use. • … and moderately (statistically significantly) with alcohol problems Example
Correlations and mediators With more data we could use mediating analyses to develop to test theories about alcohol use / problems • Say we find that people who are lonely or depressed (negative affect) have more alcohol use & problems. • Why might this be? • People with negative affect may come to expect (hope?) that alcohol will make them feel better. • The attitude may be what actually leads to alcohol use. • Here attitudes / beliefs would mediate the effect of negative affect on alcohol use & problems. Depression loneliness stress Positive attitudes toward alcohol Alcohol use & Problems Survey research
Correlations and mediators Using mediating analyses to develop to test theories about alcohol use / problems • Say we find that people who are lonely or depressed (negative affect) have more alcohol use & problems. • Why might this be? • People with negative affect may come to expect (hope?) that alcohol will make them feel better. • The attitude may be what actually leads to alcohol use. • Here attitudes / beliefs would mediate the effect of negative affect on alcohol use & problems. Using a mediating analysis to ask “why” is the core step in Theory Development. Depression loneliness stress Positive attitudes toward alcohol Alcohol use & Problems Survey research
Correlations and mediators Survey data are important for developing or testing new theories of behavior • Can have high external validity • Can model different relations among variables. Problems? • The data are correlational and cross-sectional. • The causal arrows may go in different directions. Depression loneliness stress Positive expectation of alcohol Alcohol use & Problems Survey research
Correlations and mediators Survey data are important for developing or testing new theories of behavior • Can have high external validity • Can model different relations among variables. Problems? • The data are correlational and cross-sectional. • The causal arrows may go in different directions. Genetics: Positive alcohol effects & negative affectivity • There may be a third variable that we did not measure. Depression loneliness stress Positive expectation of alcohol Alcohol use & Problems Survey research
cures Cures for correlation problems? • Longitudinalstudies • Examine changes over time to better determine cause and effect • Experimentalstudies • Simulate and manipulate the predictors, e.g.; • Induce temporary stress / negative affect • Assess attitudes • Assess alcohol use Survey research
Using Longitudinal data • To examine change • To approximate “cause and effect” First: are depression, loneliness & stress correlated? If so, we combine them into a single composite variable. This is our Predictor(Measurement version of IV) Depression Negative Emotions Loneliness Stress The same for alcohol use and problems. This is our outcome(Measurement version of DV) Alcohol use Alcohol abuse Alcohol problems Survey research
Longitudinal data: Path analysis We test the hypothesis that Negative Emotions correlate with alcohol abuse & problems… Time 1(baseline) Time 2(follow-up) …at baseline …and at follow-up Negative Emotions Negative Emotions • Data at each time frame are cross-sectional: • We cannot determine if emotions “cause” the alcohol outcome, or visa versa. Alcohol abuse Alcohol abuse Survey research
Longitudinal data: Path analysis Looking at patterns across time lets us make more sensitive statements. If the measures are reliable Negative Affect at Time 1 will correlate with NA at Time 2. Time 2(follow-up) Time 1(baseline) Negative Emotions Negative Emotions And the same for the alcohol variable Alcohol abuse Alcohol abuse Survey research
Longitudinal data: Path analysis To test the hypothesis we look at the “cross” correlations… How strongly does Affect at baseline correlate with Alcohol at follow-up? Time 1(baseline) Time 2(follow-up) Negative Emotions Negative Emotions Alcohol abuse Alcohol abuse A strong correlation would tell us that Affect does lead to more Alcohol abuse over time. Survey research
Longitudinal data: Path analysis To test the hypothesis we look at the “cross” correlations… Similarly, how strongly does Alcohol at T1 correlate with changes in Affect at T2? Time 2(follow-up) Time 1(baseline) Negative Emotions Negative Emotions Alcohol abuse Alcohol abuse This correlation tells us how much alcohol use leads to negative affect over time. . Survey research
Longitudinal data: Path analysis Testing the hypothesis: does Negative Affect ‘cause’ Alcohol use & problems Time 1(baseline) If the correlation between Affect at Time 1 and Alcohol at follow-up is very strong… Time 2(follow-up) Negative Emotions Negative Emotions Alcohol abuse Alcohol abuse Survey research
Longitudinal data: Path analysis Testing the hypothesis: does Negative Affect ‘cause’ Alcohol use & problems …and the correlation between Alcohol at T1 and Affect at T2 is relatively weak… Time 1(baseline) Time 2(follow-up) Negative Emotions Negative Emotions Alcohol abuse Alcohol abuse Survey research
Longitudinal data: Path analysis Testing the hypothesis …we can conclude that Affect may be a more important “cause” of alcohol use / problems Time 1(baseline) Time 2(follow-up) Negative Emotions Negative Emotions than the other way around. Alcohol abuse Alcohol abuse Survey research
Longitudinal data: Path analysis Testing the hypothesis Of course we may find that Alcohol “causes” Affect, not the other way around… Time 1(baseline) Time 2(follow-up) Negative Emotions Negative Emotions Either way, we have a better sense of cause and effect than with cross-sectional data. Alcohol abuse Alcohol abuse Survey research
Survey summary • Surveys typically use multiple items to measure each hypothetical construct • Correlations among items tell us if they are reliable in measuring the same construct. • We use Mediating Analyses to • Test hypotheses about correlations between constructs • Build or test theory • Cross-sectional analyses are difficult to interpret • Causal direction? • 3rd variable problem • Longitudinal analyses help us determine causal direction Summary Survey research
Psychology 242, Dr. McKirnan. Survey research 3/10/14 • Topic areas & formats • Testing Hypotheses • General issues in Survey research • Sources of bias (or fraud…) • Examples of surveys Survey research
Forms of survey administration • Self-report questionnaire • “Paper and pencil” or internet-based; • Primarily closed-ended, structured questions • Limited open-ended items • Assume at least moderate reading level • Cheap & easy to administer • Internet: Representativeness very dubious • Face-to-face interview • “Door step”, formal research center, or telephone • Allows in-depth qualitative questions • Many studies combine questionnaire & interview formats • (Telephone version becoming obsolete) All data collection increasingly computer-based Survey research
General issues in surveys • Cost / population access • Different methods are more / less likely to reach certain populations, e.g.: • Disfranchised/ poor populations often not reached by internet or telephone • Cell phones & avoidance of telemarketers less availability for telephone surveys • Stigmatized populations less available for face-to-face interviews, more available via internet. • Participant sophistication • Participants may not be able to accurately report certain topics • What factors are most important to your choice of political candidate.... • Describe the amounts and types of proteins you eat during a typical week... • “Rationality bias”; many questions (incorrectly?) assume a rational reason for behavior: • Why do you have unsafe sex... • What is your chief reason for using alcohol each night… Survey research