Download
1 / 48
510 likes | 743 Vues
The basics of traumatic brain injury, its impact on children, and educational implications. Keith Owen Yeates, Ph.D. Center for Biobehavioral Health The Research Institute at Nationwide Children’s Hospital. Department of Pediatrics College of Medicine The Ohio State University.

E N D
The basics of traumatic brain injury,its impact on children,and educational implications Keith Owen Yeates, Ph.D. Center for Biobehavioral Health The Research Institute atNationwide Children’s Hospital Department of Pediatrics College of Medicine The Ohio State University
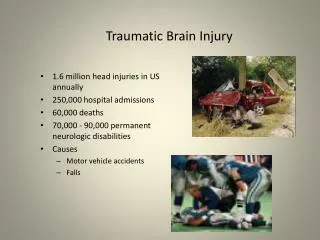
#1 cause of pediatric death and disability in U.S. Annual incidence of hospitalization for head injuries = 200-300/100,000 children More than 400,000 emergency room visits and hospitalizations per year. Why worry about pediatric TBI? Annual economic cost of pediatric TBI in the U.S. in the billions
TBI is very common among children • > 1,000,000 TBI each year • > 250,000 hospital admissions annually • Accounts for > 10% of all emergency visits • Boys at higher risk than girls • 2 to 1 for school-age children • May vary with family socioeconomic status • Varies by severity • 75-85% mild • 8-10% moderate • 6-13% severe
Age differences in incidence & etiology Durkin MS, et. al. 1998
TBI can result in multiple injuries • Primary injuries • Skull fracture • Contusion and laceration • Shear injuries • Secondary injuries • Brain swelling and edema • Increased intracranial pressure • Mass lesions • Hypoxia and hypotension
TBI can result in delayed injuries • Neurochemical cascade • Excessive free radicals • Excessive excitatory neurotransmitters • Disruption of cellular calcium homeostasis • Lactic acidosis • Late effects • Post-traumatic hydrocephalus • White matter degeneration • Post-traumatic seizures
Outcomes of TBI • TBI results in nearly 5,000 deaths annually • TBI leaves > 17,000 children with permanent disabilities annually • Multiple disabilities • Cognitive deficits • Emotional and behavioral problems • Impaired social and adaptive functioning • Declines in school performance
What happens after TBI? Neuropsychological outcomes Alertness and orientation Intellectual functioning Language skills Nonverbal skills Attention and memory Executive functions Corticosensory and motor skills
Academic performance Less effect on achievement testing More affect on classroom performance and behavior Adaptive functioning Social adjustment Emotional and behavioral adjustment Other outcomes after TBI
“Accidents” do happen! But can we explain outcomes?
When and how does recovery occur? • Developmental, biopsychosocial model • Multiple determinants • Biological • Psychological • Environmental • Developmental
Developmental predictors • Age of child at injury • Do young children have poorer outcomes? • Time since injury • Does rate of recovery change? • How long can recovery take place? • Age at assessment • Are some effects apparent only at earlier/later ages?
Are children with TBI underserved in Ohio? • In December 2002, 630 children classified as TBI • Incidence of childhood TBI resulting in hospitalization = 180/100,000 • Current population of children ages 5-17 in Ohio = 2.1 million • 3,750 children with TBI annually in Ohio • 450 to 600 in the moderate to severe range • Overall prevalence in the thousands • Not recognized or identified…a “silent epidemic”
In contrast…autism • In December 2002, 4,017 children designated autistic • Prevalence • Autism 150/100,000 • PDD spectrum 600/100,000 • Total number of children in Ohio • 3,500 with autism • 13,000 with PDD • Autism much more likely to be provided with special education services than TBI, despite similar incidence
TBI is a challenge for educators • Unique constellation of deficits • Attention • Memory • Executive functions • Behavioral regulation • A moving target • Changes over time with recovery • Variability in outcomes • Classroom performance affected more than academic achievement testing
Common problems in the classroom • Tiredness and fatigue • Irritability, impulsivity • Aggressive behavior • Passive behavior • Inappropriate social behavior • Forgetfulness • Distractibility • Difficulty following directions • Poor organizational skills • Declines in grades (From Wolcott, Lash, & Pearson, 1995)
Long-term academic achievement in children injured < 6 yrs (From Ewing-Cobbs et al., 2006)
Reading problems: Slowed processing (From Barnes & Dennis, 1999)
Math problems: Procedures, not facts (From Ayr et al., 2005)
Longitudinal profiles of achievement (From Fay et al., 2009)
Ohio Injury Follow-Up Project (1991-2002) • NIH-funded study at multiple sites • Rainbow Babies and Children’s Hospital, Cleveland • Children’s Hospital, Columbus • MetroHealth Medical Center, Cleveland • Children’s Hospital Medical Center, Akron • Investigators • H. Gerry Taylor (PI), Keith Yeates (Columbus PI), Shari Wade, Dennis Drotar, Terri Stancin, Sue Klein, Elaine Borawski, George Thompson
Study design • Two groups hospitalized for: • Moderate to severe TBI • Orthopedic injuries (OI) • Assessed children and their families • Baseline, 6 months, 12 months, and 4 years post-injury • Collected information about pre-injury and post-injury educational programs and placements from parents and schools
Behavior in school: Standardized ratings (From Yeates & Taylor, 2006)
Behavior problems vs. academic skills as predictors of classroom performance (From Yeates & Taylor, 2006)
Going back to school: Days of school missed and part-time re-entry
Are all needs being met? • Identified children with deficits after TBI • Behavioral adjustment • Adaptive behavior • Neuropsychological functioning • Academic skills • Children with deficits not provided special education • 45% at 6 months post-injury • 36% at 4 years post-injury • Unmet needs behavioral and neuropsychological
Teachers are not always aware (From Hawley et al., 2004)
The importance of transition services (From Glang et al., 2008)
Predictors of achievement:Neuropsychological testing (From Ewing-Cobbs et al., 2004)
Predictors of special education placement • Pre-injury • Behavioral adjustment • Academic performance • Baseline • Language and writing skills • Extended follow-up • Behavioral adjustment • Social competence • Adaptive behavior • Cognitive skills • IQ, language, memory, working memory, attention, executive functions • Arithmetic skills (From Taylor et al., 2003)
What is needed systemically? • Increased awareness • Teacher education • Staff training in schools • Better methods of identification • Yearly screening • Links to local hospitals • STEP project • Better methods of assessment • Neuropsychological evaluation • Studies of effectiveness of intervention
What to do?Individualized educational planning • Active experimentation is needed to identify best plan • The educational plan requires ongoing review • Inclusion in regular classrooms and routines is valuable • Educational success depends heavily on social reintegration
Evidence-based instructional approaches • Direct instruction/cognitive strategy instruction • Systematic, explicit instruction and practice • Consistent instructional routines • Effective task analysis • Systematic introduction and modeling of component skills • Use of scaffolding/guided practice • Rapid instructional pacing • Teaching to mastery (criterion referenced instruction) • Consistently high rate of success • Teaching of generalizable strategies • Planned and programmed generalization • Frequent and cumulative review (From Glang et al., 2008)
Evidence-based instruction: I (From Ylvisaker et al., 2001)
Summary • TBI results in substantial disruption of education • Many children with TBI have disabilities likely to affect their school performance • Many children with TBI receive special education services, but many have unmet needs • Many not identified • Many mis-classified • Limited scope of services • Need for intervention is early and ongoing
Websites of interest • Brain STEPS (http://www.brainsteps.net/_orbs/about/) • LEARNet (http://projectlearnet.org/) • BrainSTARS (http://www.thechildrenshospital.org/conditions/rehab/camps/brainstars.aspx) • Students with TBI - Thriving Beyond Injury (http://olrs.ohio.gov/ASP/TBISpecialEd.asp) • Brain Injury Partners (http://free.braininjurypartners.com/page/0100/)