Download
1 / 3
30 likes | 204 Vues
Monitoring of Flooded Areas Example of using passive satellite data. Can we use microwave satellite data to monitor inundation at high spatial resolution? Competing issues Passive (high repeat) data have poor (50km) spatial resolution. Active data (radar) have low repeat – 7 days to

E N D
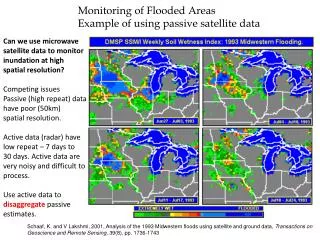
Monitoring of Flooded AreasExample of using passive satellite data Can we use microwave satellite data to monitor inundation at high spatial resolution? Competing issues Passive (high repeat) data have poor (50km) spatial resolution. Active data (radar) have low repeat – 7 days to 30 days. Active data are very noisy and difficult to process. Use active data to disaggregate passive estimates. Schaaf, K. and V Lakshmi, 2001, Analysis of the 1993 Midwestern floods using satellite and ground data, Transactions on Geoscience and Remote Sensing, 39(8), pp. 1736-1743
Monitoring of WetlandsExample of using active satellite data The Okavango Basin Semi-arid climate Precipitation - 460 mm/year Evaporation rate is 4 times higher Image http://www.ukzn.ac.za/sahg/share Comparison of the ASAR GM derived wet area in 2005 and 2006: (a) April end of rain season; (b) June dry season; (c) September maximum inundation extent. Courtesy Bartsch et al., 2009. Niger Delta (Syvitski)
Disaggregation Methodology mv change (July 7-July 5) Assuming x – radar resolution and X radiometer resolution; Known parameters: mv,X ,σ◦x , τx. y = 1.01*x+0.0001 R = 0.72 predicted in situ mv change (July 7-July 5) y = 1.02*x+0.0045 R = 0.85 predicted Change in PALSAR T at 400m resolution and AIRSAR σ◦ at 30m resolution for the period July 5 to July 7 2002. in situ Predicted vs. In-situ soil moisture change at 100m. Narayan, U., Lakshmi, V., and T. Jackson, A Simple Algorithm for Spatial Disaggregation of Radiometer Derived Soil Moisture Using Higher Resolution Radar Observations, Vol. 44, No. 6, pp 1545-1554, IEEE Transactions on Geoscience and Remote Sensing, 2006