Test for the Population Proportion
Learn how to test population proportion using z-statistic with one or two-tailed tests, critical values, and p-values in hypothesis testing scenarios.

Test for the Population Proportion
E N D
Presentation Transcript
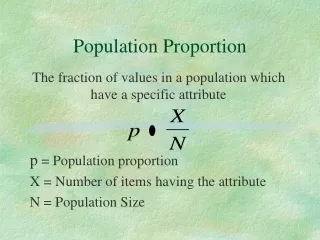
When we have a qualitative variable in the population we might like to know about the population proportion of one of the categories of the variables. For example, with gender we might like to know about the proportion who are female. In this context our hypothesis testing will follow a normal distribution and we will calculate a z statistic. We can have one or two-tailed tests. When the sample proportion is p hat = X/n, The z test stat is (p hat – p under null)/standard error. The standard error of p= sqrt[(p under null)(1 – p under null)/sample size]. Now, punder null is the hypothesized value of the proportion.
.05 Alpha/2 = .05 Upper Critical z Lower critical z Let’s do a problem. Say a magazine claims that 25% of its readers are college students. Ho: p = .25 (.25 is punder null, here) Ha: p ≠.25 With a level of significance of .1 and a two-tailed test each tail will have .05. From the z table the critical z’s are – 1.645 and 1.645.
A sample of 200 college students were asked if they read the magazine and the sample proportion that said yes was .21. The z statistic from the sample is (.21 - .25)/sqrt[(.25)(.75)/200] = - 1.31 and thus we can not reject the null. Since the z from the sample is – 1.31 and we have a two-tailed test the p-value is 2(.0951)=.1902. Note the .0951 is the tail area in the z table for a z = -1.31
Say sample proportion is 88/400 = .22 with hypothesized value = .2 Zstat = (.22-.20)/sqrt((.2)(.8)/400) = 1.00 The critical values of Z at alpha = .05 with a two tailed alternative are -1.96 and 1.96. Since our zstat is in the middle, we do not reject the null. The p-value for a Zstat = 1.00 with two tails is 2( 1- .8413) = .3174 and since this is not less than alpha = .05 we do not reject.