Download
1 / 41
410 likes | 439 Vues
Learn to effectively present diverse data using charts and tables. Steps and examples for presenting categorical and numerical variables. Improve information visualization skills.

E N D
Presenting Datain Charts and Tables Hartanto, SIP, MA Ilmu Hubungan Internasional Fakultas Ilmu Sosial dan Ekonomi Universitas Respati Yogyakarta 2012
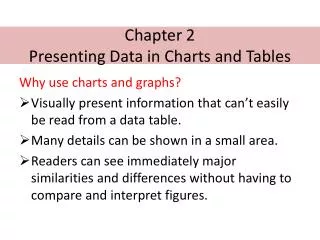
In an information-overloaded world, you need to present information effectively.You can present categorical and numerical data efficiently using chartsand tables. Studying this class can help you learn to select and developcharts and tables for each type of data.
Steps to Present Categorycal Variables • Sortvariable values according tothe categories of the variable. • Place the count, amount, or percentage(part of the whole) of each category into a summary table or into one of several types of charts.
The Summary Table • Concept • A two-column table in which category names are listed in thefirst column and the count, amount, or percentage of values are listed in asecond column. Sometimes,additional columns present the same data inmore than one way (for example, as counts and percentages).
Interpretation • Summary tables enable you to see the big pictureabout a set of data. In this example, you can conclude that more than half thepeople pay by check and almost 75% either pay by check or by electronic/online forms of payment.
Question Example Survey Penggunaan Alat Transportasi oleh Mahasiswa untuk Pergi Ke Kampus (N=100) Buatlah Summary Table dari data diatas?
The Bar Chart (Diagram Batang) • Concept • A chart containing rectangles (“bars”) in which the length ofeach bar represents the count, amount, or percentage of responses of one category.
Interpretation • A bar chart is better than a summary table at makingthe point that the category “pay by check” is the single largest category forthis example. For most people, scanning a bar chart is easier than scanning acolumn of numbers in which the numbers areunordered, as they are in the bill payment summary table.
Question Example Survey Penggunaan Alat Transportasi oleh Mahasiswa untuk Pergi Ke Kampus (N=100) Buatlah Bar Chart dari data diatas?
Steps to Create Bar Chart • Buat garis absis (x) dan ordinat (y). • Tentukan judul dari absis (x) dan ordinat (y) sesuai dengan tabel distribusi frekuensi yang ada. • Tentukan penskalaannya berdasarkan batas riil (nyata). • Buat kota persegi empat pada absisnya dan disesuaikan dengan frekuensi pada ordinatnya.
The Pie Chart (Diagram Bagian Bulat) • Concept • A circle chart in which wedge-shaped areas—pie slices—representthe count, amount, or percentage of each category and the entire circle (“pie”) represents the total.
Interpretation • The pie chart enables you to see each category’s portionof the whole. You can see that most of the adults pay their monthly billsby check orelectronic/online, a small percentage pay with cash, and thathardly anyone paid using another form of payment or did not know how they paid.
Question Example Survey Penggunaan Alat Transportasi oleh Mahasiswa untuk Pergi Ke Kampus (N=100) Buatlah Pie Chart dari data diatas?
The Pareto Chart • Concept • A special type of bar chart that presents the counts, amounts,or percentages of each category in descending order left to right, and alsocontains a superimposed plotted line that represents a running cumulative percentage.
Question Example Survey Penggunaan Alat Transportasi oleh Mahasiswa untuk Pergi Ke Kampus (N=100) Buatlah Pareto Chart dari data diatas?
You present numerical variables either in tables or charts. • To create a tableyou first establish groups that represent separate ranges of values and thenplace each value into the appropriate group. • To create a chart, you use the groups from the table.
The Frequency and Percentage Distribution • Concept • A table of grouped numerical data that contains the names ofeach group in the first column, the counts (frequencies) of each group in thesecond column, and the percentages of each group in the third column. Thistable can also appear as a two-column table that shows either the frequencies or the percentages. • Interpretation • Frequency and percentage distributions enable you toquickly determine differences among the many groups of values.
Contoh: Hasil UAS Pengantar Ilmu Hubungan InternasionalFISE RESPATI
Histogram • Concept • A special bar chart for grouped numerical data in which thefrequencies or percentages in each group ofnumerical data are represented asindividual bars on the vertical Y axis and the variable is plotted on the horizontalX axis. In a histogram, in contrast to a bar chart of categorical data, nogaps exist between adjacent bars. • Interpretation • Histograms reveal the overall shape of the frequenciesin the groups. Histograms are considered symmetric if each side of the chartis an approximate mirror image of the other side.
Contoh Soal: Hasil UAS Pengantar Ilmu Hubungan InternasionalFISE RESPATI. Buatlah Histogram dari data Dibawah ini.
The Time Series Plot • Concept • A chart in which each point represents the value of a numericalvariable at a specific time. By convention, the X axis (the horizontal axis)always represents units of time, and the Y axis (the vertical axis) always representsunits of the variable.
Concept • All the charts presented in this class enhance our understanding of thedata being presented. Such graphs are considered “good” graphs. • Unfortunately, many charts that you encounter in the mass media or in formalreports are “bad” charts that misuse the techniques discussed in thisclass. • Bad charts mislead, unnecessarily complicate things, or are justplain incorrect and should always be avoided.
Interpretation • Using pictorial symbols, instead of bars or pies, alwaysobscures the data and can create a false impression in the mind of the reader,especially if the pictorial symbols are representations of three-dimensionalobjects.
In Example 1, the wine glass symbol fails to communicate that the1997 data (6.77 million gallons) is almost twice the 1995 data (3.67 milliongallons), nor does it accurately reflect that the 1992 data (2.25 million gallons)is a bit more than twice the 1.04 million gallons for 1989.
Example 2 combines the inaccuracy of using a picture (grape vine) insteadof a standard shape with the error of having unlabeled and improperly scaledaxes. A missing X axis prevents the reader from immediately seeing that the1997–1998 value is misplaced. By the scale of the graph, that data pointshould be closer to the rest of the data. A missing Y axis prevents the readerfrom getting a better sense of the rate of change in land planted through theyears. Other problems also exist. Can you spot at least one more? (Hint:Compare the 1949–1950 data to the 1969–1970 data.)
I’m open for your questions Thank You !