1 / 3

Comparative Analysis of pCO2 Models for 2009-2010: ECCO2 vs CCSM KS BLEND

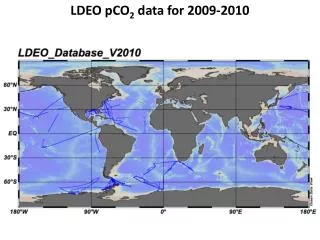
Explore the comparison of pCO2 data for 2009-2010 using ECCO2 model against CCSM KS BLEND, including cost analysis and optimized results. Dive into an in-depth evaluation presented through the optimized Taylor diagram to determine if it provides a better way to display the results.

Télécharger la présentation

Comparative Analysis of pCO2 Models for 2009-2010: ECCO2 vs CCSM KS BLEND

An Image/Link below is provided (as is) to download presentation Download Policy: Content on the Website is provided to you AS IS for your information and personal use and may not be sold / licensed / shared on other websites without getting consent from its author. Content is provided to you AS IS for your information and personal use only. Download presentation by click this link. While downloading, if for some reason you are not able to download a presentation, the publisher may have deleted the file from their server. During download, if you can't get a presentation, the file might be deleted by the publisher.

E N D

Presentation Transcript


  1. LDEO pCO2 data for 2009-2010

  2. Model (ECCO2) vs. Data: pCO2 Cost: J = 74.6 J = 69.1 J = 75.7 CCSM KS BLEND Cost: J = 78.2 J = 66.1 J = 62.7 Optimized = -0.35 * CCSM + 1.19 * KS + 0.38 * BLEND + -0.23 * NOBM IC NOBM IC Lin.Combi. Optimized

  3. Taylor diagram: A better way to display results?

More Related