Download
1 / 18
180 likes | 280 Vues
Learn how to apply linear programming to maximize profit by identifying constraint points and optimizing objective functions in various scenarios.

E N D
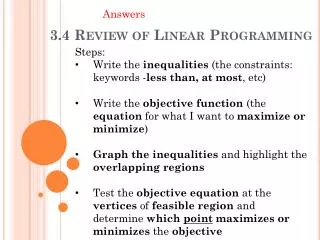
Steps • 1. Solve for y and graph each inequality. • 2. Find the common area that the inequalities cover. Determine the boundaries of this common area. • 3. Find locations where the graph changes direction. Mark these points. These are your constraint points. • 4. You will be given an equation. To determine which constraint point maximizes the equation, plug each constraint point into the equation
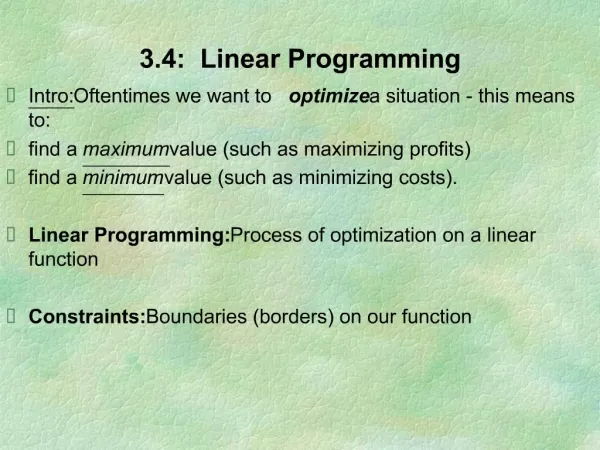
What is Linear Programming? Linear Programming is a technique that identifies the minimum and maximum value of some quantity. The quantity is modeled with an objective function, a separate equation that is used to determine what the maximum and minimum constraint points of the region will be.
What is a constraint? A constraint is a limit on the variables in the objective function. The constraints are the linear inequalities that are used to find the feasible region. Let’s revisit the two graphs we looked at last lecture.
GRAPHING CONSTRAINTS x + y ≥ -1 x – y ≤ 6 y ≤ 2 y ≥ -x – 1 y ≥ x – 6 y ≤ 2 (8 , 2) (-3 , 2) Which point maximizes f(x,y) = x + 2y ? _____________________________ _____________________________ _____________________________ (-3 , 2) f(-3,2) = -3 + 2(2) = 1 (8 , 2) f(8,2) = 8 + 2(2) = 12 (2.5 , 3.5) (2.5 , 3.5) f(2.5,3.5) = 2.5 + 2(3.5) = 9.5
GRAPHING CONSTRAINTS 2 ≤ x ≤ 6 1 ≤ y ≤ 5 x + y ≤ 8 2 ≤ x and x ≤ 6 1 ≤ y and y ≤ 5 y ≤ -x + 8 (3, 5) (6, 2) (2, 5) Which point maximizes f(x,y) = x – 2y ? _____________________________ _____________________________ _____________________________ _____________________________ _____________________________ (2, 5) f(2,5) = 2 – 2(5) = -8 (3 , 5) f(3,5) = 3 – 2(5) = -7 (6 , 2) f(6,2) = 6 – 2(2) = 2 (2, 1) (6 , 1) f(6,1) = 6 – 2(1) = 4 (6, 1) (2 , 1) f(2,1) = 2 – 2(1) = 0
Using a graphing calculator, let’s graph the following inequalities with an objective function of P = 13x + 2y -3x + 2y < 8 -8x + y >-48 x>0 y>0 y < 3/2x +4 y >8x -48 x>0 y>0 First step: get the equations into slope-intercept form (solve for y)
Now let’s use our Graphing Calculator. Take out your Linear Programming Cheat Sheet.
Linear ProgrammingExample #1 • You want to buy tickets for some concerts; rock and jazz. • You want at least 5 rock tickets and at least 8 jazz tickets. • No more than 25 tickets total. • Rock tickets cost $30 and jazz tickets cost $20. • You cannot spend more than $600. Find the max # of tix each you can buy at the lowest price total.
STEP 1 Set up Equations Use each piece of information given to make an equation or restraint. For our example x = rock Y= jazz At least 5 rock tix x > 5 At least 8 jazz tix y > 8 No more than 25 tickets x + y < 25 Rock tix costs $30 , jazz tix cost $20. No more than $600 20x + 30y < 600 Objective function P=20x+30y
STEP 2 GRAPH Use your calculator x > 5 y > 8 x + y < 25 20x + 30y < 600
STEP 3POINTS OF INTERSECTION X = rock Y = jazz (5,16.6) (15,10) (17,8) (5,8)
STEP 4TEST VERTICES INTO OBJECTIVE FUNCTION Now it is time to test the vertices to see what combination of x and y, rock and jazz respectively, will give us the max number of tickets at the lowest price. Objective Notation (x , y) f(x , y) = 20x + 30y (5 , 8) f(5, 8) = 20(5) + 30(8) = $ 340 (15 , 10) f(15, 10) = 20(15) + 30(10) = $ 600 (17 , 8) f(17, 8) = 20(17) + 30(8) = $ 580 (5 , 16.6) f(5, 16.6) = 20(5) + 30(16.6) = who cares..?
Linear ProgrammingExample #2 A pizza shop makes $1.50 on each small pizza and $2.15 on each large pizza. On a typical day, it sells between 70 and 90 small pizzas and between 100 and 140 large pizzas. The shop can make no more than 210 pizzas in a day. How many of each size of pizza must be sold to maximize profit?
STEP 1 Set up Equations Use each piece of information given to make an equation or restraint. For our example x = small pizzas Y= large pizzas Between 70 and 90 small pizzas 70 < x < 90 Between 100 and 140 large pizzas 100 < y < 140 Shop can make no more than 210 pizzas x + y < 210 Objective function A pizza shop makes $1.50 on each small pizza and $2.15 on each large pizza. P=1.50x+2.15y
STEP 2 GRAPH Use your calculator 70 < x < 90 100 < y < 140 x + y < 210 140 130 120 110 100 70 80 90 100
STEP 3POINTS OF INTERSECTION (70,140) (90,120) 140 130 120 (70,100) (90,100) 110 100 70 80 90 100
STEP 4TEST VERTICES INTO OBJECTIVE FUNCTION Now it is time to test the vertices to see what combination of x and y, small and large pizzas respectively, will give us the max profit. Objective Notation (x , y) f(x , y) = 1.50x + 2.15y (70 , 140) f(70, 140) = 1.50(70) + 2.15(140) = $ 406 (90 , 120) f(90, 120) = 1.50(90) + 2.15(120) = $ 393 (70 , 100) f(70, 100) = 1.50(70) + 2.15(100) = $ 320 (90 , 100) f(90, 100) = 1.50(90) + 2.15(100) = $ 350