Investigating J/ψ Nuclear Absorption in Proton-Nucleus Collisions: NA50 Collaboration Insights
This presentation from the NA50 Collaboration explores J/ψ production in proton-nucleus collisions across various energies (450 GeV, 400 GeV, 200 GeV) and targets (Be, Al, Cu, Ag, W, Pb). Emphasizing the need for a baseline in understanding J/ψ nuclear absorption, the work includes comprehensive data analyses, comparisons to previous ion collisions, and findings from joint fits using the Glauber model. The results contribute to the understanding of nuclear matter effects on quarkonium production, essential for future heavy-ion collision studies.

Investigating J/ψ Nuclear Absorption in Proton-Nucleus Collisions: NA50 Collaboration Insights
E N D
Presentation Transcript
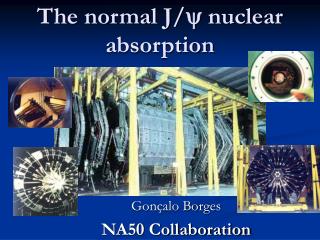
The normal J/y nuclear absorption Gonçalo Borges NA50 Collaboration
Outline • The physical motivation • Data sets and experimental setups • Data analyses • Proton-nucleus Bmm s(J/y)/A results • 450 GeV, 400 GeV, 200 GeV • Comparison with ion Bmm s(J/y)/AB results • 200 GeV O-Cu, O-U, S-U and 158 GeV Pb-Pb • Comparison with ion Bmm s(J/y) /s(DY)2.9-4.5 results • 200 GeV S-U and 158 GeV Pb-Pb • Conclusions NA50 Collaboration@Hard Probes 2004 - Ericeira - Portugal
Motivation • NA50 studies J/y production in Pb-Pb collisions at 158 GeV. • A very well grounded baseline, describing the normal J/y nuclear absorption, has to be established. ► Study J/y production measured in proton collisions with several A targets. • Extrapolate the expected J/y normal nuclear behaviour (as deduced from p-A collisions) to heavier systems. NA50 Collaboration@Hard Probes 2004 - Ericeira - Portugal
Available p-A data sets • Several experiments have measured J/y production, in proton-nucleus collisions, at different energies and kinematical domains: • NA50 experiment • p-A (A = Be, Al, Cu, Ag,W) at 450 GeV • p-A (A = Be, Al, Cu, Ag, W, Pb) at 400 GeV • NA51 experiment • pp, pd at 450 GeV • NA38 experiment • p-A (A = C, Al, Cu, W) at 450 GeV • p-A (A = Cu, W, U) and A-B (O-Cu, O-U, S-U) at 200 GeV • NA3 experiment • pp, pPt at 200 GeV Same Spectrometer NA50 Collaboration@Hard Probes 2004 - Ericeira - Portugal
Experimental setups NA50 Collaboration@Hard Probes 2004 - Ericeira - Portugal
Data analyses • NA50, NA51 and NA38 analyses are performed with identical methods. • The experimental dimuon opposite-sign mass spectrum is analysed through a fit including several ingredients: • J/y → m+m- • y’ → m+m- • Drell-Yan process • Correlated semileptonic decays of open charm mesons. • Combinatorial background NA50 Collaboration@Hard Probes 2004 - Ericeira - Portugal
NA51 and NA38 joint a fit • NA38 has measured J/y production in several systems at 450 GeV and 200 GeV. • NA38results are compiled in PLB 466 (1999) 408 and analysed together with NA51 450 GeV pp, pd results. • J/y nuclear dependence was parametrized as s(J/y) = s0 Aa NA50 Collaboration@Hard Probes 2004 - Ericeira - Portugal
NA51 and NA38 joint Glauber fit • A Glauber Model was used to describe J/y nuclear dependence production • If NA51 results are excluded from the Glauber fit, we obtain: ►Possible normalization problem between NA51 and NA38 450 GeV p-A results? NA50 Collaboration@Hard Probes 2004 - Ericeira - Portugal
NA50 Glauber fit results • NA50 has 3 different p-A data collections, at 2 different energies and using several targets (A=Be,Al,Cu,Ag,W,Pb) • Results from different data sets are compatible ► Perform a simultaneous Glauber fit sabs = 4.1±0.5 mb NA50 Collaboration@Hard Probes 2004 - Ericeira - Portugal
NA51 and NA50 joint Glauber fit • Glauber fit results including NA51 data • NA51 results are consistent with the extrapolated Glauber behaviour from the NA50 450 GeV p-A results. ► No apparent problem in normalization between NA51 and NA50 450 GeV p-A results. sabs = 4.1±0.4 mb NA50 Collaboration@Hard Probes 2004 - Ericeira - Portugal
NA51, NA50 and NA38 Glauber fit • NA50 and NA38 p-A 450 GeV results are not in agreement regarding normalization. ►Possible systematic problem on NA38 cross-section measurements when compared to NA50. sabs = 4.1±0.4 mb NA50 Collaboration@Hard Probes 2004 - Ericeira - Portugal
NA51, NA50 and NA38 Glauber fit • We revisited the NA38 studies. • A problem was found in the NA38 450 GeV p-A reconstruction. • This problem does not affect the NA38 p-A 200 GeV results (at much lower intensity beam). • An overall ~11% correction has to be applied to the NA38 450 GeV p-A results. (Corrected) sabs = 4.1±0.4 mb NA50 Collaboration@Hard Probes 2004 - Ericeira - Portugal
NA50 and NA38 comparisons • The fact that NA50 450 GeV p-A results are now compatible with NA38 450 GeV p-A results (within 2-3%) indicate that: • The systematic differences between the two experiments are small and under control; • NA50 data at 450/400 GeV can be safely compared with NA38 data at 200 GeV, in terms of slopes and normalizations. NA50 Collaboration@Hard Probes 2004 - Ericeira - Portugal
NA38 and NA3 200 GeV Glauber fit • The 200 GeV NA38 p-A results are not sufficient to extract sabs. • NA3 has measured J/y production in pp and pPt collisions at 200 GeV. The inclusion of these data in the Glauber fit will constrain the sabs determination. sabs = 3.3±3.0 mb NA50 Collaboration@Hard Probes 2004 - Ericeira - Portugal
Comparison of sabs results • Glauber fit results to the 450/400 GeV p-A data: • sabs is determined with bad accuracy at 200 GeV. However, these data are important since they establish the normalization at lower energies. • sabs results for the different energies are compatible ► Assume sabs is constant between 450, 400 and 200 GeV. • Glauber fit results to the 200 GeV p-A data NA50 Collaboration@Hard Probes 2004 - Ericeira - Portugal
Final sabs results • Final results are obtained from a simultaneous Glauber fit performed for the 450/400/200 GeV p-A data sabs = 4.1±0.4 mb NA50 Collaboration@Hard Probes 2004 - Ericeira - Portugal
Experimental rescaling to 200 GeV • The ratios N0200/N0450 and N0200/N0400are used to scale down J/y absolute cross -sections from higher energies to 200 GeV. • The rescale systematic error (7.8%) is not included in the data error bars. sabs = 4.1±0.4 mb NA50 Collaboration@Hard Probes 2004 - Ericeira - Portugal
Comparison with NA38 light ion data • The A-B data from NA38 are not included in the Glauber fits. • They are just plotted and compared with the corresponding Glauber estimation deduced from p-A data. sabs = 4.1±0.4 mb NA50 Collaboration@Hard Probes 2004 - Ericeira - Portugal
Comparison with NA50 Pb-Pb results • NA50 has also measured Pb-Pb J/y absolute cross-section at 158 GeV. • The “Schuler parametrization” (in energy and xF) is used to scale down all data from the 200 GeV kinematical domain to the 158 GeV kinematical domain. • The Pb-Pb J/y production result is compared with the extrapolated Glauber behaviour deduced from p-A data with no assumptions at all regarding A-B results. sabs = 4.1±0.4 mb NA50 Collaboration@Hard Probes 2004 - Ericeira - Portugal
y absorption curve as a function of L • The same absorption curve, with sabs=4.1±0.4 mb, is drawn as a function of L, the average path length of J/y in nuclear matter, for the 3 different energies: • 450 GeV • 400 GeV • 200 GeV NA50 Collaboration@Hard Probes 2004 - Ericeira - Portugal
y absorption curve as a function of L (2) • The absorption curve is directly compared with NA38 Bmm s(y) /AB results at 200 GeV. • The absorption curve has to be scaled down to the NA50 158 GeV kinematical domain for a direct comparison with Pb-Pb Bmm s(y) /AB results. sabs = 4.1±0.4 mb NA50 Collaboration@Hard Probes 2004 - Ericeira - Portugal
p-A Bmm s(y) /s(DY)2.9-4.5sabs result • Bmm s(y) /s(DY)2.9-4.5 results in p-A collisions are extracted from NA51 and NA50 data. A Glauber fit is performed using these measurements: sabs = 4.2±0.4 mb • This sabs value is in good agreement with the one obtained from Bmm s(y) /AB results (sabs = 4.1±0.4 mb). sabs = 4.2±0.4 mb NA50 Collaboration@Hard Probes 2004 - Ericeira - Portugal
y/DY absorption curve as a function of L sabs = 4.2±0.4 mb • The y/DY absorption curve is scaled down to 200 GeV using the J/y experimental rescales measured in p-A data and a LO DY calculation. • S-UBmm s(y) / s(DY)2.9-4.5 results at 200 GeV are compared with the absorption curve. NA50 Collaboration@Hard Probes 2004 - Ericeira - Portugal
y/DY absorption curve as a function of L (2) • Bmms(y) / s(DY)2.9-4.5 Pb-Pb results are compared with an absorption curve scaled down from 200 GeV to 158 GeV using Schuler energy/xF dependence and a LO DY calculation. sabs = 4.2±0.4 mb NA50 Collaboration@Hard Probes 2004 - Ericeira - Portugal
Summary and Conclusions • J/y production was deeply studied using the available p-A data at different energies (450, 400 and 200 GeV) from several experiments (NA51, NA50, NA38 and NA3). • From the J/y absolute cross-section used in this study, we have obtained • sabs(450, 400 GeV) = 4.1 ± 0.4 mb • sabs(200 GeV) = 3.3 ± 3.0 mb allowing us to assume that sabs may be the same within the energy range and kinematical domains of the different experiments. NA50 Collaboration@Hard Probes 2004 - Ericeira - Portugal
Summary and Conclusions (2) • Results from a simultaneous fit to p-A data at the different energies and kinematical domains, give sabs= 4.1 ± 0.4 mbandallow to scale down absolute cross-section from higher energies to 200 GeV. • We observe that the J/y NA38 O-Cu, O-U and S-U results lie on top of the absorption curve deduced from p-A data. • Pb-Pb results are systematically below the absorption curve, either in: • Bmm s(y) /AB measurements • Bmm s(y) /s(DY)2.9-4.5 measurements NA50 Collaboration@Hard Probes 2004 - Ericeira - Portugal