Download
1 / 1
10 likes | 215 Vues
Distinct Structure and Intensity in Hurricanes Katrina and Ophelia (2005). Jie Ming 1,2 and Shuyi S. Chen 1 1 RSMAS/University of Miami 2 Department of Atmospheric Sciences, Nanjing University. 1. Introduction

E N D
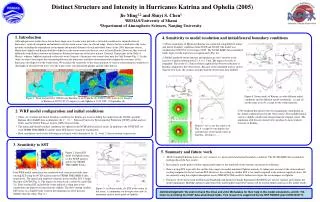
Distinct Structure and Intensity in Hurricanes Katrina and Ophelia (2005) Jie Ming1,2 and Shuyi S. Chen1 1RSMAS/University of Miami 2Department of Atmospheric Sciences, Nanjing University 1. Introduction Although previous studies have shown that a large area of warm water provides a favorable condition for intensification of hurricanes, storm development and intensity over the warm ocean varies in a broad range. Various factors contribute to the storm intensity including the atmospheric environment and internal dynamic of each individual storm. In the 2005 hurricane season, Hurricanes Ophelia and Katrina both developed over the warm water near the east coast of South Florida. However, they evolved differently with distinct structure and intensity. Katrina became one of the most intense Category 5 hurricanes in the Gulf of Mexico, whereas Ophelia remained a relatively weak Category 1 hurricane over several days near the Gulf Stream (Fig. 1). In this study, we aim to investigate the relationship between the hurricanes and their environment and examine the structures of the hurricanes developed over the warm water. We examine the sensitivity of the storm intensity to various environmental conditions to shed light on why they both move over the warm water, one intensified quickly and the other did not. (d) (b) (c) (a) Figure 1: Track and intensity of Hurricane Katrina (a) and Ophelia (b). TMI 85 GHz microwave imagery of Katrina at 2052 UTC 27 August (c) and Ophelia at 1510 UTC 11 September (d). 2. WRF model configuration and initial conditions • Three sets of initial and lateral boundary conditions for Katrina are used, including the output from the NCAR ensemble Kalman filter (EnKF) data assimilation, the 1°×1° National Centers for Environmental Prediction (NCEP) global analysis fields, and the Global Forecast System (GFS) forecast fields. • The initial and lateral boundary conditions for Ophelia is the NCEP global analysis fields. In addition to the NCEP SST, we used TRMM TMI/AMSR-E satellite daily SST data for sensitivity experiments. • Both simulations used vortex-following nested grids with 4 domains at 36, 12, 4 and 1.3 km resolution, respectively. 3. Sensitivity to SST (a) (b) Figure 2: Initial SST fields for Ophelia from (a) the NCEP analysis and (b) the TRMM TMI/AMSR-E data. (b) (a) Four WRF model simulations are conducted with constant and daily time-varying SST using the NCEP analysis and the TRMM TMI/AMSR-E data, respectively. The spatial and temporal variations in the satellite SST is larger than that of NCEP (Fig. 2). The impact on storm track is relatively small (Fig. 3a). Time-varying SST included the storm-induced cooling later in the simulations and improved storm intensity slightly. The time-varying satellite SST seems to a slightly better result in the minimum sea-level pressure (MSLP) than the others (Fig. 3c). (c) (d) Figure 3: (a) Storm tracks, (b) SST at the center of the storm, (c) minimum sea-level pressure and (d) maximum surface wind speed of Ophelia. 4. Sensitivity to model resolution and initial/lateral boundary conditions 1) Three simulations of Hurricane Katrina are conducted using different initial and lateral boundary conditions from NCEP and NCAR. The model was initialized at 0000 UTC on 26 August 2005. The NCAR EnKF data assimilated fields improved the track forecast significantly (Fig. 4a). 2) Model simulated storm structure and intensity are very sensitive to the increase of grid resolution from 12, 4, to 1.3 km. The impact on tracks is negligible. The result of 1.3km resolution captured the observed structure of Katrina compared to the observations. Because of the simulated track is slower than the best track, the storm is stronger than the observation near landfall. (a) (b) (c) (d) (a) (b) Figure 4: Storm tracks of Katrina (a) with different initial conditions and (b) different model resolutions. (c) and (d) are the same as in (b), except for the storm intensity. 3) We modified the initial vortex by changing the wind profile in the initial condition based on the observations. The modified initial vortex is slightly smaller and stronger than the original vortex. The simulation with the new initial vortex produced a more realistic structure of Katrina. (d) (c) Figure 5: (a)-(c) are the same as in Fig. 4, except for varying the size and intensity of the initial vortex in Katrina. (d) and (e) ….. (e) 5. Summary and future work • Model simulated Katrina tracks are very sensitive to various initial and lateral boundary conditions. The NCAR EnKF data assimilated fields produced the best results. • Increasing in model grid resolution significantly improve the simulated storm structure and intensity in Katrina. • Time-varying SST, especially the satellite data, improves model simulated Ophelia intensity by taking into account of the storm-induced cooling compared to that of constant SST. However, the cooling in satellite SST is too small compared to the airborne reported values. We are currently using the coupled atmosphere-ocean (WRF-HYCOM) model to further investigate the ocean impact on Ophelia. • Extensive observations from the Hurricane Rainbands and Intensity Change Experiment (RAINEX) are used to evaluate and validate the model simulations. Multiple airborne radar reflectivity and Doppler wind observations will be used in further analysis of the model results. Acknowledgment. We wish to thank Wei Zhao and John Michalakes for their help in the model simulations, and Dr. Y.S. Chen for providing the EnKF data assimilated fields. This research is supported by the NSF RAINEX grant ATM-0432717.