Download
1 / 83
860 likes | 1.03k Vues
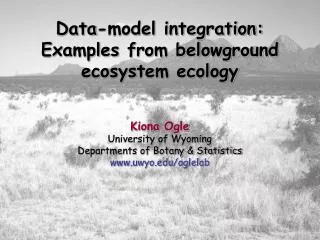
Data-model integration: Examples from belowground ecosystem ecology Kiona Ogle University of Wyoming Departments of Botany & Statistics www.uwyo.edu/oglelab. Today’s Task. What are some ecological questions to which sensor network data could be applied?

E N D
Data-model integration: Examples from belowground ecosystem ecology Kiona Ogle University of Wyoming Departments of Botany & Statistics www.uwyo.edu/oglelab
Today’s Task • What are some ecological questions to which sensor network data could be applied? • How would those data be used in models? • Overview modeling of ecological data and processes.
Types of Questions • What are some ecological questions to which sensor network data could be applied? • Spatial & temporal processes • Improved ecological understanding • More accurate prediction & forecasting • Example problems • “Biogeochemical exchanges between the atmosphere & biosphere” • How do environmental perturbations affect carbon & water exchange? • Partitioning ecosystem processes & components • Linking processes & mechanisms operating at multiple temporal & spatial scales
How to Address Such Questions? • Couple data and models • Sensor network data • Very rich • Real-time; large datasets; spatially extensive and/or temporally intensive • Heterogeneous • Different locations, processes, and conditions • Models & data analysis • Less appropriate: • “Classical” analyses that assume linearity and normality of data • Design-based inference about patterns • More appropriate: • Coupling of process-based models with diverse and rich datasets • Model-based inference about patterns and mechanisms
Why Couple Data & Process Models? • Parameter estimation (or “model parameterization”) • Quantification of uncertainty • Improved predictions and forecasts • Decision support, management, conservation • Synthesize multiple types of data • Relate different system components to each other • Learn about important mechanisms • Hypothesis generation • Use data-informed models to generate testable hypotheses • Inform sampling and network design • Data analysis • Go beyond simple “classical” analyses • Explicit integration of multiple data types, diverse scales, and nonlinear and non-Gaussian processes
Process parameters Unknown quantities Observed data Latent (or true) process Data parameters Posterior Likelihood Probabilistic process model Prior(s) How to Couple Data & Process Models? • Multiple approaches, for example: • Maximum likelihood-based models • Least squares, minimization of objective functions • Hierarchical Bayesian models • Hierarchical Bayesian approach • Recall, from Jennifer’s talk …
Outline • The process model: • Types of ecological models • Building process models • Examples from belowground ecosystem ecology: • Motivating issues • Ex 1: Estimating components of soil organic matter decomposition • Ex 2: Deconvolution of soil respiration (i.e., CO2 efflux) • In both examples, highlight: • Data sources • Process models • Data-model integration • Implications of data-model integration for sensor network data & applications
Process parameters Unknown quantities Observed data Latent (or true) process Data parameters Posterior Likelihood Probabilistic process model Prior(s) Hierarchical Bayesian Model Data model (likelihood) Probabilistic process model The “process model”
The Process Model • Model formulation: • Explicit, mathematical eqn’s • Systems equations • State-space equations • Conceptual model: • Systems diagrams • Graphical models Inputs Outputs “Compare” Conceptual model Mathematical model Unobserved quantities (parameters) Observed quantities (data) Analytical output Observed quantities (driving variables) Numerical/ simulation output “Predict” Simulation model Unobserved or latent quantities The “process model”
Types of Process Models Jorgensen (1986) Fundamentals of Ecological Modelling. 389 pp. Elsevier, Amsterdam.
Upcoming Example: Soil Carbon Cycle Model
Example Process Model Pools or state variables Simplified systems diagram of the soil carbon cycle in a temperate forest Flows of carbon Source: Xu et al. (2006) Global Biogeochemical Cycles Vol. 20 GB2007.
Model Formulation A:matrix of flux rates or “carbon transfer coefficients” (parameters) u(t): flux of carbon into the system(e.g., photosynthetic flux) (driving variable or modeled quantity) B:vector of ‘allocation fractions’ (parameters) X:vector of state variables (unobservable latent quantities, outputs) Source: Xu et al. (2006) Global Biogeochemical Cycles Vol. 20 GB2007.
Model Formulation Observable (data) Source: Xu et al. (2006) Global Biogeochemical Cycles Vol. 20 GB2007.
Process parameters Unknown quantities Observed data Latent (or true) process Data parameters Posterior Likelihood Probabilistic process model Prior(s) How to Couple Data & Process Models? • Hierarchical Bayesian approach Data model (likelihood) Probabilistic process model
Outline • The process model: • Types of ecological models • Building process models • Examples from belowground ecosystem ecology: • Motivating issues • Ex 1: Estimating components of soil organic matter decomposition • Ex 2: Deconvolution of soil respiration (i.e., CO2 efflux) • In both examples, highlight: • Data sources • Process models • Data-model integration • Implications of data-model integration for sensor network data & applications
Ecosystem Processes Emphasis on aboveground What about belowground?
Biogeochemical Cycles H20 N H20 N H20 C C P
H20 N H20 N H20 C C P Biogeochemical Cycles Belowground system is critical Tightly linked to aboveground system
Belowground “Issues” Aboveground • Lots of info • Easy to measure Belowground • Little info • Difficult to measure • Aboveground measurements (helpful but limited) Outstanding issues • Partitioning above- & belowground • Quantifying & partitioning belowground • Implications for ecosystem function • Examples: arid & semiarid systems Figure from Kieft et al. (1998) Ecology 79:671-683
Motivating Questions: Soil Carbon Cycle • From where in the soil is CO2 coming from? • What are the relative contributions of autotrophs vs. heterotrophs? • What factors control decomposition rates & heterotrophic activity? • How does pulseprecipitationaffect sourcesof respiredCO2? • Implications ofclimate changefor desert soilcarbon cycling?
Integrative Approach • Diverse data sources • Experimental & observational • Lab & field studies • Multiple scales • Varying “amounts” & “completeness” • Process-based models • Key mechanisms, processes, components • Balance detail & simplicity • Multiple scales & interactions • Statistical models: data-model integration • Hierarchical Bayesian framework • Mark chain Monte Carlo
Ex 1: Soil organic matter decomposition Objectives: • Identify soil & microbial processes affecting decomposition • Learn how vegetation (i.e., microsite) controls these processes
Experimental Design Mesquite shrubland in southern Arizona Microsite types: • bare ground • grass • small mesquite • big mesquite Bare ground Grass Small mesquite Big mesquite 3 cores (reps)
Experimental Design ... Add water ... Add sugar + water Incubate at 25 oC CO2 Measure CO2 efflux (soil respiration rate) at 24 & 48 hours CO2 8 depths (layers) CO2
Experimental Design ... Add water ... Add sugar + water Measure: Microbial biomass Soil organic carbon Soil nitrogen Incubate at 25 oC CO2 Measure CO2 efflux (soil respiration rate) at 24 & 48 hours CO2 8 depths (layers) CO2
Design & Data Overview • Full-factorial design: • Microsite • 4 levels: bare, grass, small mesq, big mesq • Soil layer • 8 levels: 0-2, 2-5, ..., 40-50 cm • Substrate addition type • 2 levels: water only, sugar + water • Incubation time • 2 levels: 24, 48 hrs • Soil core or rep • 3 cores per microsite • Stochastic data: • Soil respiration rate • N = 359 (25 missing) • Microbial biomass • N = 18 (14 missing) • Soil organic carbon • N = 89 (7 missing)
Analysis Objectives microbes soil C CO2 flux Estimate microbial respiration (decomposition) parameters (i.e., process parameters) ? ? Soil depth data Respiration biomass & activity Microbial biomass Carbon substrate
Saturating carbon (C) Respiration (R) Low C Microbial biomass (B) Process Model: Soil Respiration Estimate microbial respiration (decomposition) parameters (i.e., process parameters) Respiration Microbial biomass Carbon substrate Michaelis-Menton type model: microbial “base-line” metabolic rate microbial carbon-use efficiency Assume Ac related to “substrate quality”:
Data-Model Integration • Full-factorial design: • Microsite • Soil layer • Substrate addition type • Incubation time • Soil core or rep B C R N • Stochastic data: • Soil respiration rate • Microbial biomass • Soil organic carbon • Things to consider: • Multiple data types • Nonlinear model • Missing data • Experimental design some data some data
Data Model (Likelihood) • Let LR = log(R) • For microsite m, soil depth d, soil core r, substrate-addition type s, and time period t: Mean (“truth”) (latent process) Observationprecision (= 1/variance) Observed rate
Data Model (Likelihood) • Now, for the covariates... • For microsite m, soil depth d, and soil core r: • Note: the likelihoods are for both the observed and missing data Observed Mean (“truth”) (latent process) Observation precision (= 1/variance)
Data Model (Likelihood) Likelihood components Data parameters Latent processes
Probabilistic Process Model Latent processes Deterministic model for soil microbes & carbon contents Stochastic model for latent respiration
Probabilistic Process Model Stochastic model for latent respiration Specify expected process: Michaelis-Menten (process) model
Probabilistic Process Model Process components Process parameters
Parameter Model (Priors) Data parameters Process parameters Conjugate, relatively non-informative priors for precision terms
Parameter Model (Priors) Data parameters Process parameters Non-informative Dirichlet priors for relative distributions of microbes and carbon Multivariate version of the beta distribution (with all parameters set to 1: multidimensional uniform)
Parameter Model (Priors) Data parameters Process parameters Relatively non-informative (diffuse) normal priors for the rest:
The Posterior No analytical solution for the joint posterior distribution No analytical solution for most of the marginal distributions Approximate the posterior: Markov chain Monte Carlo methods,implemented in WinBUGS
Example Results C* (total soil carbon, g C/m2) B* (microbial biomass, g dw/m2) Bare Bigmesq. Med.Mesq. Grass Bare Bigmesq. Med.Mesq. Grass
Example Results Bare ground Big mesquite Relative amount ofmicrobial biomass Surface Deep Surface Deep Soil depth (or layer)
Ex 2: Deconvolution of Soil Respiration • From where in the soil is CO2 coming from? • What are the relative contributions of autotrophs vs. heterotrophs? • What factors control decomposition rates & heterotrophic activity? • How does pulseprecipitationaffect sourcesof respiredCO2? • Multiple datasources • lots • limited data data data data data data data data