Download
1 / 15
150 likes | 303 Vues
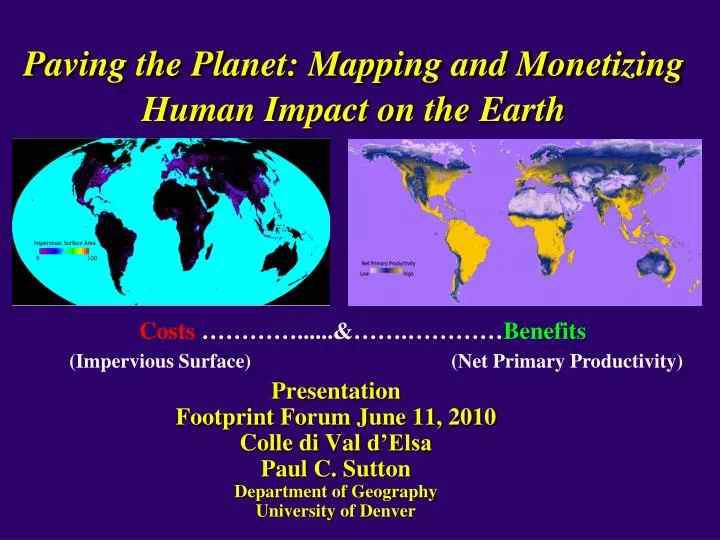
Paving the Planet: Mapping and Monetizing Human Impact on the Earth. Presentation Footprint Forum June 11, 2010 Colle di Val d’Elsa Paul C. Sutton Department of Geography University of Denver. Costs …………......&…….………… Benefits (Impervious Surface) (Net Primary Productivity).

E N D
Paving the Planet: Mapping and Monetizing Human Impact on the Earth Presentation Footprint Forum June 11, 2010 Colle di Val d’Elsa Paul C. Sutton Department of Geography University of Denver Costs …………......&…….…………Benefits (Impervious Surface)(Net Primary Productivity)
Approach and Assumptions • The impact of Human Activity on the earth can be mapped and monetized using Impervious Surface Area as a proxy. • The value of the world’s ecosystem services can be mapped and monetized using Net Primary Productivity as a proxy. • Human Impact is Balanced with Ecosystem Service at the Global Scale and valued at roughly the global GDP of $50 Trillion.
Global Estimates of ISA have been developed using simple OLS models derived from DMSP nighttime imagery and LandScan Population Density
Our Preliminary work suggests Impervious Surface Area is a reasonable proxy measure of Ecological Footprint Impervious Surface Area per Person vs. ecological footprint per person for 149 countries using Ecological Footprint Data from Wackernagel et. Al.
Mapping the Dollar Value of Ecosystem Services • Valuation and mapping of ecosystem service is a contested and challenging enterprise. • We chose to use Net Primary Productivity (NPP) as a proxy of ecosystem service value because it is an interesting proxy of where solar energy conversion takes place. • Other measures based on land cover, biome, spatial context etc. could also be explored. Costanza, R; d’Arge, R; de Groot, R; Farber, S; Grasso, M; Hannon, B; Naeem, S; Limburg, K; Paruelo, J; O’Neill, R; Raskin, R; Sutton, P; van den Belt, M; (1997) The Value of the World’s Ecosystem Services and Natural Capital Nature Vol 387 May 15
Global Datasets of Net Primary Productivity have been developed and explored Imhoff, Marc L., Lahouari Bounoua, Taylor Ricketts, Colby Loucks, Robert Harriss, and William T. Lawrence. 2004. Global patterns in human consumption of net primary production. Nature, 429, 24 June 2004: 870-873.
This is hopefully a provocative exercise exploring ideas of carrying capacity, I = P*A*T, Ecological Footprints, Ecosystem Service Valuation, and Sustainable Development We simply allocate $50 Trillion of ‘COST’ via the Global Map of Impervious Surface and allocate $50 Trillion of ‘Benefit’ via the Global Map of NPP. The rationale for equivalence is an assumption that we are at some sort of ‘Carrying Capacity’. The rationale for $50 Trillion is it is roughly equivalent to the Global Annual Gross Domestic Product. Wackernagel, M. and Rees, W., 1996, Our Ecological Footprint: Reducing Human Impact on the Earth. New Society Publishers, Gabriola Island, BC Canada. 176 p. ISBN: 9780865713123.
Spatially Explicit Representation of$ Value of NPP - $ Cost of Impervious Surface Next few slides are national aggregations of $ NPP, $ ISA, & Difference
Aggregate National Map of Dollar Benefit of Ecosystem Services using NPP proxy
Aggregate National Map of Dollar Cost of Human impact using ISA proxy
Aggregate National Map of $ Benefit of NPP - $ Cost of ISA Sutton, Paul; (2003) An Empirical Environmental Sustainability Index derived solely from Nighttime Satellite Imagery and Ecosystem Service Values 2003 Population and Environment 24(4)
Discussion Questions? • Does this make any sense? • Is ISA a good spatially explicit choice for the ‘cost’ of human impact? • Is NPP a good spatially explicit choice for the ‘benefits’ of ecosystem services? • Is $50 Trillion a reasonable number to use? • How big a sin is it to ignore the oceans? • Is this a fair balance with respect to ongoing population vs. consumption debates?