Download
1 / 89
890 likes | 910 Vues
Explore how greenhouse gases impact Earth's climate, focusing on Northwest region; assess future climate predictions using advanced models and downscaling techniques.

E N D
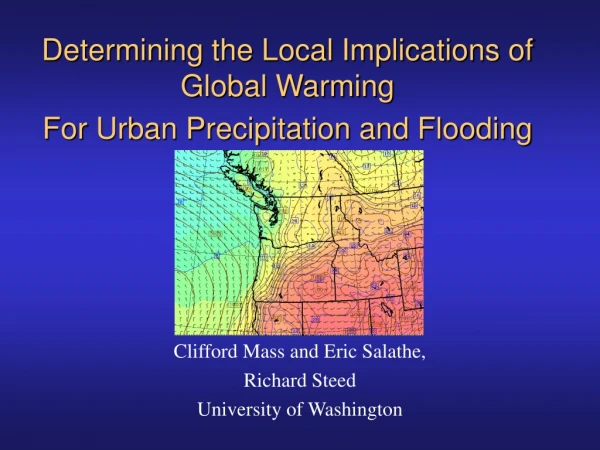
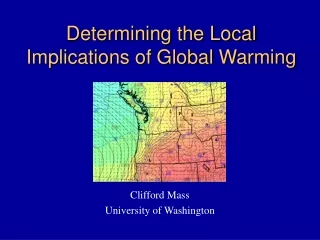
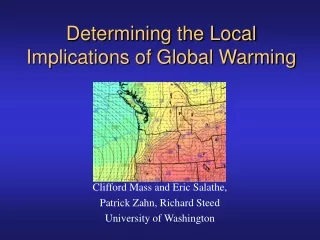
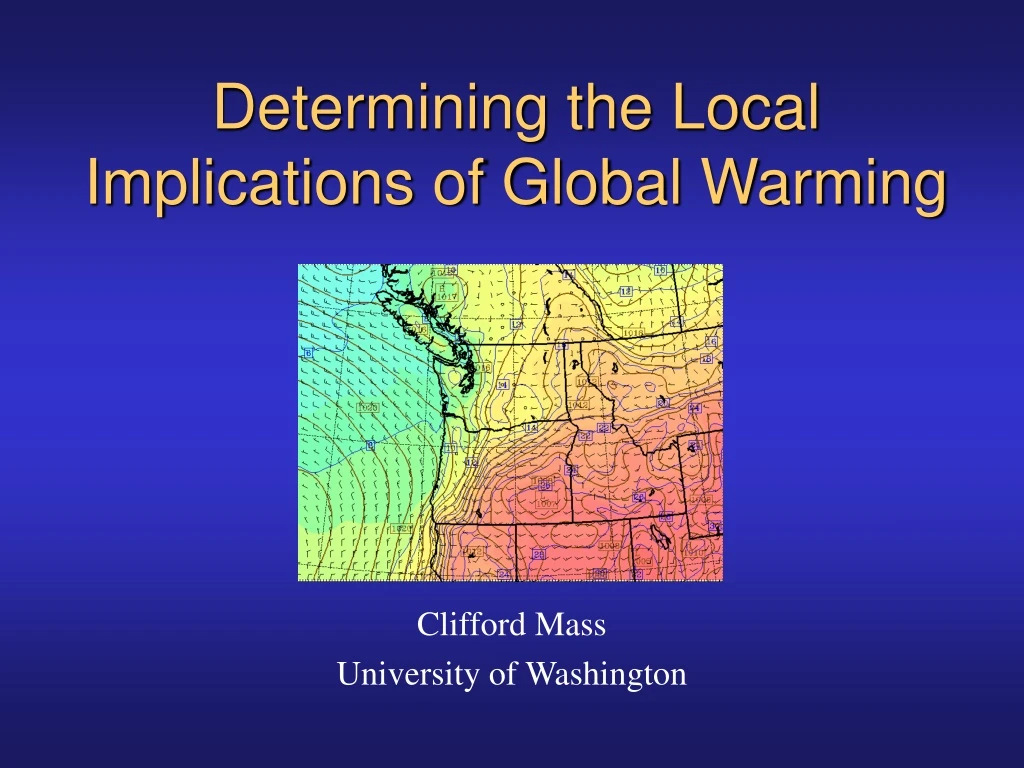
Determining the Local Implications of Global Warming Clifford Mass University of Washington
What is a Greenhouse Gas? • A greenhouse gas is a gas that that is relatively transparent to solar radiation, but absorbs and emits in the infrared…the type of radiation the earth emits. • Some examples: • Water vapor • Carbon dioxide • Nitrous oxide • Methane
Partly (infrared) Greenhouse Gases Make the Earth Warmer by Slowing the Loss of Infrared Radiation
The Problem: Rapidly Rising Greenhouse Gases Due to Mankind
Amplifiers of Global Warming • There are a number of natural “amplifiers” of mankind’s emission of greenhouse gases. • The warming due to increased carbon dioxide, methane, and other greenhouse gases will cause more water to be evaporated from the earth’s oceans. • Water vapor is the most potent greenhouse gas and thus causes even MORE warming. • This is called a positive feedback
Even more… • Warming temperatures melt snow and ice. • Snow and ice help cool the planet because they reflect much of the sun’s radiation….that is why you need sunglasses while skiing. • As the snow melts, less radiation is reflected to space and more is absorbed. • Thus, the earth gets warmer, which melts more snow. • Another positive feedback!
1979 2003
Is Global Warming Already Happening? • Finding the global warming signal is made more difficult because the earth’s climate has a substantial amount of natural variability. • Also the warming due to man was relatively small prior to the middle of last century before the large increase in fossil fuel usage. • The consensus of most atmospheric scientists is that some global warming due to man is now evident.
Eleven of the twelve warmest years in the past 150 years have occurred in the past twelve years (1995-2006)
But is greenhouse warming occurring in the Northwest? • Finding the signal is made more difficult here by large interdecadal variability--e.g., the Pacific Decadal Oscillation.
Greenhouse Warming in the NW? • Also there are large influences by the regions high terrain and proximity to the ocean. How do they change the story? • There have been some major claims of large local effects--e.g., snowpack reduction of 50%….but are they really true?
The Technology of Prediction • Atmospheric scientists use complex climate prediction models…called General Circulation Models…to predict the future climate. • These models are similar to weather forecast models, but allow the gases in the atmosphere to change. • They also simulate the evolution of the oceans.
Technology of Prediction • Have to assume the future emission of greenhouse gases by mankind…a major uncertainty. • These models are not perfect and cannot exactly replicate the current climate….but they are close enough for useful results and getting better each year.
But what about the NW? What are the implications of global warming for the Northwest? How will our mountains and land-water contrasts alter the story? Do global models tell us the full story? Will there be any surprises?
Regional Climate Prediction • As noted earlier, to understand the impact of global warming, one starts with general circulation models (GCMs) that provide a view of the global evolution of the atmosphere. • Even leading GCMs only describe features of roughly 500 km or larger in scale.
Northwest weather is dominated by terrain and land-water contrasts of much smaller scale. • In order to understand the implications of global changes on our weather, downscaling of the GCM predictions considering our local terrain and land use is required.
Model Topography and Resolution MM5 Topo (15 km) ECHAM5 Topo (150km)
Downscaling • The traditional approach to use GCM output is through statistical downscaling, which finds the statistical relationship between large-scale atmospheric structures and local weather. • Statistical downscaling either assumes current relationships will hold or makes simplifying assumptions on how local weather works.
Downscaling Such statistical approaches may be a reasonable start, but may give deceptive or wrong answers… since the relationships between the large scale atmospheric flow and local weather might change in the future.
Downscaling • There is only one way to do this right… running full weather forecasting models at high resolution over extended periods, with the large scale conditions being provided by the GCMs ...this is called dynamical downscaling. • Such weather prediction models have very complete physics and high resolution, so they are capable of handling any “surprises”
Downscaling • Computer power and modeling approaches are now powerful enough to make dynamical downscaling realistic. • Takes advantage of the decade-long work at the UW to optimize weather prediction for our region.
UW Regional Climate Simulations • Makes use of the same weather prediction model that we have optimized for local weather prediction: the MM5. • 10-year MM5 model runs nested in the German GCM (ECHAM). • MM5 nests at 135 km, 45 km, and 15 km model grid spacing.
MM5 Model Nesting • 135, 45, 15 km MM5 domains • Need 15 km grid spacing to model local weather features.
Regional Modeling • Ran this configuration over several ten-year periods: • 1990-2000-to see how well the system is working • 2020-2030, 2045-2055, 2090-2100
Details on Current Study: GCM • European ECHAM model with resolution roughly equivalent to having grid points spaced ~ 150 km apart. Can resolve features of roughly 600 km size or more. • IPCC climate change scenario A2 -- aggressive CO2 increase (doubling by 2050) IPCC Report, 2001 IPCC Report, 2001
Why Such Strong Warming on Mountain Slopes..Particularly in Spring? • Probable Answer: Snow melt resulting in more solar heating.
Change in Water Of Snowpack (%)