Download

1 / 14
140 likes | 320 Vues
NagiosGrapher Viewing the history of metrics. Felix Ehm CERN IT-GD-ITR. Content. Existing monitoring in Nagios Introduction to NagiosGrapher Installation & Configuration NagiosGrapher Web Interface Advantages/Disadvantages. Existing monitoring in Nagios. Nagios Reports.

E N D
NagiosGrapherViewing the history of metrics Felix EhmCERN IT-GD-ITR
Content • Existing monitoring in Nagios • Introduction to NagiosGrapher • Installation & Configuration • NagiosGrapher Web Interface • Advantages/Disadvantages
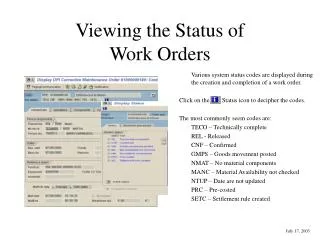
Existing monitoring in Nagios • Nagios Reports
Introduction to NagiosGrapher • Introduction • Nagios extention to monitor service metrics developed by NETWAYS • Post-processes Nagios probe output • Uses RoundRobinDatabases for storing metric values (min,max,avg) • Offers web interface to create/watch graphs for choosen service metric values in a specific time periods (current, daily, weekly, monthly, yearly) • PERL based scripts • RPM’s available for SUSE (Ubuntu next) (Nagios Plugin Output) ./check_icmp -H localhost OK - localhost: rta 0.054ms, lost 0%|rta=0.054ms;200.000;500.000;0; pl=0%;40;80;; NagiosGrapher RRDTools
Installation • Installation • If you have a RPM file – be lucky! • Otherwise: • Download package from www.nagiosexchange.org / www.sourceforge.net • Shipped installation guide: NagiosGrapher/doc/INSTALL • configure with autoconf and ‘configure’ • SLC : configure --layout redhat • fix missing packages • Install Iterative process
Configuration (NagiosGrapher) • Configuration files are similar to Nagios ones (*.ncfg) • Main configuration file: /etc/nagios/ngraph.ncfg • Other files usually in /etc/nagios/ngraph.d/.* • Main NagiosGrapher executable : /usr/lib/nagios/plugins/contrib/collect2.pl • Runs as daemon and post processes output from Nagios either through named pipe or network • But also: /usr/lib/nagios/plugins/contrib/fifo_write.pl • Wrapper for standard Nagios fifo_write module to enable write timeout • ngraph.ncfg: • change: perffile_path directive must be commented
Configuration (Nagios) • nagios.cfg • add: cfg_dir=/etc/nagios/serviceext • add: service_perfdata_file=/tmp/service-perfdata • change: process-performance-data=1 • change: service_perfdata_command=process-service-command • commands.cgi: • change: service-perfdata-command command_line directive .. # 'process-service-perfdata' command definition define command{ command_name process-service-perfdata command_line /usr/lib/nagios/plugins/contrib/fifo_write.pl /var/log/nagios/rw/ngraph.pipe '$HOSTNAME$\t$SERVICEDESC$\t$SERVICEOUTPUT$\t$SERVICEPERFDATA$\n' 3 } One liner!
Startup • Activate NagiosGrapher service check configuration files • NagiosGrapher reads all *.ncfg files recursively in /etc/nagios/ngraph.d/ • e.g. check_ping.ncfg_disabled rename to check_ping.ncfg • Restart Nagios • Start NagiosGrapher • Watch the logfile • tail –f /var/log/nagios/ngraph.log • Successful? • Reduce loglevel from default (255, heavy trace) to lower level no log rotation!
Week Current Month Day Year NagiosGrapher Web Interface Interface to choose values/time scope
Advantages ‘Easy’ to install Creates RRDs on the fly Creates serviceext info for page integration on the fly Easy adaptable to own service checks Real time graphing Future work Logrotate in next version Graph ‘zooming’ Disadvantages Problems at large scale ~7000 services: 20min to update RRD files Heavy weight operation: Regular expressions to find values in service performance output Graphs can’t show two different scales (two y-axis) Little bugs NagiosGrpaher init script doesn’t work correctly PERL complains about uninitialized variables Advantages/Disadvantages