Download
1 / 23
230 likes | 470 Vues
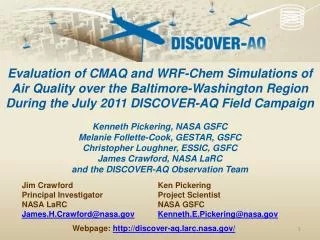
Evaluation of CMAQ and WRF- Chem Simulations of Air Quality over the Baltimore-Washington Region During the July 2011 DISCOVER-AQ Field Campaign Kenneth Pickering, NASA GSFC Melanie Follette-Cook, GESTAR, GSFC Christopher Loughner, ESSIC, GSFC James Crawford, NASA LaRC

E N D
Evaluation of CMAQ and WRF-Chem Simulations of Air Quality over the Baltimore-Washington Region During the July 2011 DISCOVER-AQ Field Campaign Kenneth Pickering, NASA GSFC Melanie Follette-Cook, GESTAR, GSFC Christopher Loughner, ESSIC, GSFC James Crawford, NASA LaRC and the DISCOVER-AQ Observation Team Ken Pickering Project Scientist NASA GSFC Kenneth.E.Pickering@nasa.gov Jim Crawford Principal Investigator NASA LaRC James.H.Crawford@nasa.gov Webpage: http://discover-aq.larc.nasa.gov/
Investigation Overview Deriving Information on Surface Conditions from Column and VERtically Resolved Observations Relevant to Air Quality A NASA Earth Venture campaign intended to improve the interpretation of satellite observations to diagnose near-surface conditions relating to air quality Objectives: 1. Relate column observations to surface conditions for aerosols and key trace gases O3, NO2, and CH2O 2. Characterize differences in diurnal variation of surface and column observations for key trace gases and aerosols 3. Examine horizontal scales of variability affecting satellites and model calculations NASA UC-12 NASA P-3B Deployments and key collaborators Maryland, July 2011 (EPA, MDE, UMd, and Howard U.) SJV, California, January/February 2013 (EPA and CARB) Texas, September 2013 (EPA, TCEQ, and U. of Houston) TBD, Summer 2014 NATIVE, EPA AQS, and associated Ground sites
Deployment Strategy Systematic and concurrent observation of column-integrated, surface, and vertically-resolved distributions of aerosols and trace gases relevant to air quality as they evolve throughout the day. Three major observational components: NASA UC-12 (Remote sensing) Continuous mapping of aerosols with HSRL and trace gas columns with ACAM NASA P-3B (in situ meas.) In situ profiling of aerosols and trace gases over surface measurement sites Ground sites In situ trace gases and aerosols Remote sensing of trace gas and aerosol columns Ozonesondes Aerosol lidar observations
Science Flights July 2011 DISCOVER-AQ data allow extensive evaluation of regional air quality models.
P-3B flights spiral over MDE sites (typically 3 times per day, 2 hours apart)
WRF and CMAQ Simulations 36 km horizontal resolution • Time period: 24 May – 5 August • Re-initialize WRF every 3 days except for soil temperature and soil moisture • Length of each WRF run: 3.5 days (first 12 hours of each run is discarded) • Initial and Boundary Conditions: North American Regional Reanalysis and MOZART Chemical Transport Model • CMAQ run offline 12 km 4 km 1.33 km
WRF/Chem simulation - Options • Simulation length: 6/27/2011 12Z – 8/2/2011 0Z • Meteorology was initialized every three days
WRF/Chem O3 curtain and Weinheimer in-situ O3 from the P3-B Flight #2 Tuesday 7/5/2011 Overall, WRF/Chem reproduced the O3 observed during the campaign well Model output profile following the flight Data from P3-B (60 sec average shown) Model PBL height
WRF/Chem O3 curtain and Weinheimer in-situ O3 from the P3-B Flight #2 Saturday 7/2/2011 On several occasions, WRF/Chem underestimated O3 above the PBL
PBL mean biases: WRF-Chem 4.5 ppbv CMAQ 7.9 ppbv FT mean biases: WRF-Chem 3.0 ppbv CMAQ 1.7 ppbv
WRF/Chem NO2 curtain and Weinheimer in-situ NO2 from the P3-B Flight #7 Saturday 7/16/2011 High bias in NO2 was evident in the PBL
PBL mean biases: WRF-Chem 0.81 ppbv CMAQ 0.19 ppbv FT mean biases: WRF-Chem -0.13 ppbv CMAQ -0.03 ppbv
PBL mean biases: WRF-Chem 0.53 ppbv CMAQ 1.38 ppbv FT mean biases: WRF-Chem 0.12 ppbv CMAQ 0.35 ppbv
PBL mean biases: WRF-Chem 0.98 ppbv CMAQ 0.80 ppbv FT mean biases: WRF-Chem 0.32 ppbv CMAQ 0.24 ppbv
PBL mean biases: WRF-Chem -0.85 ppbv CMAQ -1.11 ppbv FT mean biases: WRF-Chem -0.46 ppbv CMAQ -0.40 ppbv
PBL mean biases: WRF-Chem -0.06 ppbv CMAQ -0.29 ppbv FT mean biases: WRF-Chem -0.04 ppbv CMAQ -0.05 ppbv
Summary of Mean Biases: Green < ±10% Red > ±10% SpeciesWRF-ChemCMAQ BLFTBLFT O3HighHighHighHigh NO2HighLowHighLowNO2 emissions too large? PNs HighHighHighHighConversion to PAN too rapid? ANs HighHighHighHighLifetime too long? HCHO LowLowLowLowVOC emissions too small? HCHO primary emissions? Isoprene LowLowLowLowIsoprene emissions in both BEIS3 and MEGAN low? CO HighLowHighHigh
Summary • The DISCOVER-AQ Maryland mission provided over 250 atmosphericprofiles of trace gases and aerosols mostly in the 0.3 to 3 km layer • CMAQ had slightly lower mean bias at surface sites compared with WRF-Chem • Compared with P-3B aircraft observations, mean biases over all 14 flights were < ±10% for WRF-Chem O3, CMAQ FT O3, CMAQ NO2, CO from both models, and WRF-Chem PBL isoprene • Problem species in both models: peroxy nitrates, alkyl nitrates, HCHO, and isoprene • Recycling more PNs and ANs back to NOx will increase the existing high biases for O3 • Model evaluation using OMI tropospheric NO2 data underway • Data from Maryland campaign publicly available; next mission in Jan/Feb 2013 in San Joaquin Valley, California.
Typically BC obs 600-800 ng/m3 Typically BC obs ~50 ng/m3