Weather Notes
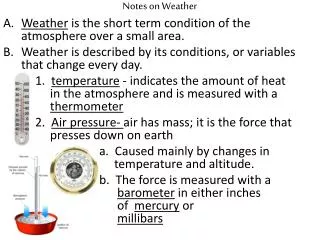
Weather Notes. Wind- moving air caused by differences in air pressure (uneven heating of the earth). A. Instruments used my Meteorologist 1 . wind vane- weather vane (direction) 2. Anemometer- wind from any direction will catch one arm and start it moving. (speed and direction)

Weather Notes
E N D
Presentation Transcript
Wind- moving air caused by differences in air pressure (uneven heating of the earth) • A. Instruments used my Meteorologist • 1. wind vane- weather vane (direction) • 2. Anemometer- wind from any direction will catch one arm and start it moving. (speed and direction) • 3. weather balloons- winds in upper atmosphere - fewer changes in speed and direction - move faster
Jet stream • - located near tropopause at latitude 30oN and 30oS are high-speed bands of wind. • -speeds, sizes, positions, and shapes vary from day to day, and season to season. • Summer – jet stream is near U.S./Canadian border. Tropical air masses pushed North. • Winter – jet stream moves south cold air moves south.
Coriolis effect- • - northern hemisphere deflected to the right. • - southern hemisphere deflected to the left.
Front – boundary between two air masses. • - air masse change temp. and humidity at the front. • Signs of fronts.1. a line of clouds 2. falling barometer 3.change in wind direction 4. temperature change • numbers 2 through 4 show a front is passing by. • -fronts are drawn in regions of great change in temp. and wind direction. This is where isobars tend to bend. (shape is generally a wedge)
Warm Fronts • Warm Front: warm air slides over departing cold air- large bands of precipitation form(cirrus). This is the symbol on a map for a warm front
Cold Fronts • Cold air pushes under a warm air mass. Warm air rises quickly=narrow bands of violent storms form(cumulus). This is the symbol for a cold front
Occluded Front • 2 air masses merge and force warm air between them to rise quickly. Strong winds and heavy precipitation will occur (cumulonimbus) This is the weather map symbol for an occluded front
Stationary Front • Warm or cold front stops moving. Light wind and precipitation may occur across the front boundary (stratus) This is the weather map symbol for a stationary front
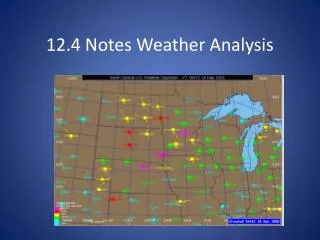
Weather Maps – overall picture of weather across the earth. • local conditions to national weather service 8 times a day. • -Station Model- group of symbols, shows weather • - measures the following from ground to make surface: Temperature wind direction cloud cover Air pressure dew point cloud type Wind speed visibility precipitation
What’s on the station model 1. Air pressure • - if rises, air mass moves over. (improving weather) • -if falls, a front or low pressure is approaching, often precipitation. (a change in weather) 2. Wind direction • -winds shift from southwest to northwest a cold front is located. • -winds shift from east to southeast a warm front is located.
Station model 3. Clouds • -cirrus to cirrostratus and altostratus is a warm front and rain for a long time. • -cirrus to dark cumulonimbus is a cold front and a violent storm but not for a long time. 4. Wind speed 5. Temperature • -dropping temperature is a clue to a cold front. • -rising temperature is a clue to a warm front.
Weather forecasting-conditions measured for a forecast (weather stations)
Steps to produce a surface map. 1. station models printed on map 2. isobars are drawn • a. circled areas that represent lowest pressure and labeled lows • b. smaller circled areas that represent highest pressure and labeled highs 3. isotherms are drawn in occasionally. 4. meteorologist analyze map, mark the line for fronts and shade precipitation.
Reading a weather map • ISOBAR= connects areas of equal pressure BAR comes from BARometric pressure
Reading a weather map... • Isotherm: Connects areas of equal temperature; therm means temperature
Movement of weather systems • - are in straight lines unless acted upon by another air mass. 1. pattern of movement shows both direction and speed of system. 2. forecast based on prediction of position of system. • forecast only accurate for about 12 hours. • long-range forecasts- very general based on seasonal averages of temperature and pressure and winds in upper troposphere.
How can we find information on weather patterns? • 1. ground readings • 2. buoys take radio readings • 3. ships report conditions • 4. satellites • 5. Radar • 6. Doppler radar
Storms • Thunderstorm-violent weather system • Produces- Cumulus clouds; Strong winds; Heavy rain; Lightning; Thunder; Hail; Tornadoes • -more than 120 people a year killed by lightning from thunderstorms. • -Form- cold front, warm air is pushed up by an advancing cold mass. • Storm moves- growth of clouds, speed of wind increases and Cumulonimbus clouds form. • -high winds of upper troposphere push top of cloud forward making an – anvil-shaped top.
1. Lightning- discharge of electricity from a thunder cloud to the ground or to another cloud. • - temperature of a lightning flash reaches 28,000 oC 2. Thunder- sudden expansion of the air. • -Rumbling- sound is spread out in time or echo in a mountain. • -Heat lightning- glow of lightning so far away that its thunder can not be heard.
Tornadoes • - small funnel-shaped whirlwind that spins in a counterclockwise direction around an area of very low pressure. • -wind speeds can be greater then 500km/h • - pressures are so low that a closed building will explode • - develops with in a cumulonimbus cloud • - forms during spring and early summer in middle of country • - travels at speed of 30km/h to 60km/h • - only lasts a few minutes
Conditions: • layer of warm moist air with cooler drier air above it. • How does it start? 1. hypothesis: lightning helps by heating air making it less dense, causing air to rise. 2. hypothesis: extreme differences in temperature between air on ground and air in upper troposphere start air rising.
Hurricane • large tropical cyclone that develops in the doldrums, usually during the late summer • Western Pacific Ocean called a typhoon and in Indian ocean called a cyclone. • - hurricanes form in areas where air is normally gently rising. • - 70% of hurricanes in the Atlantic Ocean form along west coast of Africa.
Water is the fuel that causes a hurricane to increase in speed and power. • hurricanes are speeds of 119km/ hr and up • - tropical storms are speeds of 63km/hr to 118km/hr • -more dangerous than the wind and rain is the tidal surge ( bulge in ocean under the light air) this raises the ocean level by 8 meters.
How it Forms: • 1. the faster the air moves over the ocean, the more water vapor it picks up • 2. the more water vapor in the air releases more heat increasing the winds. • 3. the longer the storm stays over water, the more this cycle continues and the stronger the storm.
Eye- center area of calm • -the air is slowly sinking and the sky is clear • - fastest winds found in a ring around the eye
Naming Hurricanes • - six year cycle • -named alphabetically with male and female alternating
Watch and Warning • National severe storms forecast center is in Kansas City, Missouri. Watch- covers an area of 100 km by 200 km. • - gives time when they are possible Warning- when one has actually been sighted. • - gives location and area where it is likely to go