Download
1 / 19
190 likes | 328 Vues
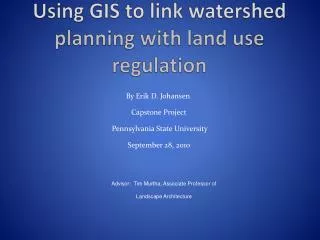
Using GIS to link watershed planning with land use regulation. By Erik D. Johansen Capstone Project Pennsylvania State University September 28, 2010. Advisor: Tim Murtha, Associate Professor of Landscape Architecture . Background. Water in Washington State Watershed planning

E N D
Using GIS to link watershed planning with land use regulation By Erik D. Johansen Capstone Project Pennsylvania State University September 28, 2010 Advisor: Tim Murtha, Associate Professor of Landscape Architecture
Background • Water in Washington State • Watershed planning • Water use regulation • Washington Department of Ecology • Water rights • When do you need one? • Closed Basin • Exempt water well withdrawals • RCW 90.44.050 allows up to 5000 gal. per day for domestic use • From Washington State Department of Community, Trade and economic development
Background Continued • Land use Planning in Washington State • Land use regulations in Washington State • The Growth Management Act (GMA) • Shoreline Master Program • Land use regulation in Stevens County • GMA planning county since 1993 • No zoning until 2007 • Outdated regulations • The growth management Act (14 goals including protecting the environment) • From Washington State Department of Community, Trade and economic development
Watershed Planning • Washington Administrative Code (WAC 173-559) closed the WRIA 59 basin to new surface water rights. • New ground water rights still open until 1994 when a court case (John Postema vs. Pollution Control Hearings Board, et al). • Interpretation of the case lead to the closure of new ground water withdrawals in closed basins. • In 1998 the Watershed Planning Act was adopted. • In 1999, WRIA 59 Watershed Planning team was formed. From Golder Associates Inc. 2006, executive summary 1-2
Study Area Figure 1: Map of the major watersheds that are partially or fully located in Stevens County. As you can see, the Colville (WRIA 59) watershed is nearly completely contained within Stevens County. Inset map of Washington State for reference. Data gathered from Stevens County Information Services Department as public information.
The Colville Water Resource Inventory Area (WRIA 59) • Colville River watershed is known by WRIA 59 in WAC 173-000 • Includes approximately 1,300 square miles • All but one (1) percent of WRIA 59 is in Stevens County • WRIA team working since 2000 (over 23,000 personnel hours) WRIA 59 Mission Statement “Develop a long range sustainable Watershed Plan that locally directs management and implementation of this Plan to address current and future water needs, while working to help protect and improve the water resources within the Colville River Watershed.” From Golder Associates Inc. 2006, executive summary 1-2
Objectives • Develop a dynamic land quantity analysis (LQA) model with variable land use regulation data Process: • Use GIS to create a LQA model at the WRIA 59 Sub-basin level (See figure 2 on slide 8) • Make some of the LQA criteria variable • Combine the LQA model with population growth trend data Outcomes: • Use the model outcome data during the WRIA 59 rule amendment negotiations • Output GIS maps and charts that show how changes in land use affect the potential water uses • Demonstrate how much future domestic water use will occur in each sub-basin and how land use will help minimize potential impacts.
WRIA 59 Sub-Basins (23 total) Figure 2: Map of the sub-basins located in the WRIA 59 watershed. Data gathered from Stevens County Information Services Department as public information. Not to scale.
Project AssumptionsThese assumptions are being made during the development of the LQA model. They help define the project’s scope of detail and answer questions about how the LQA has been set-up. • The WRIA 59 sub-basins will remain the same. • There are currently 3 different sub-area maps (WRIA 59-group’s, Department of Ecology, USGS) • The sum of the sub-basins is equal to the WRIA 59 watershed. • Lands with existing exempt wells and or existing electric meters are already developed. • Model parameters will be adopted by the WRIA group • Publically owned lands will not develop into residential properties. • Large timber ownerships will be removed by other model criteria.
DATA Table 1: Table of data for the project including data type, source, and how the data will be used.
Methods • Data preparation • Add data to the GIS • Define the data parameters (coordinate system, datum, projection, etc…) • Add in each layers making sure they are in the correct coordinate system and projection. • Clip data to the relevant study area (WRIA 59 watershed) • All of the data will be clipped to the WRIA 59 watershed boundary. • Data Analysis • Convert data from existing form to raster data • Most of the data are polygon shape files or polygon data in a gdb • Raster grid cell size • While converting data, I will use a grid cell size of 100 sq ft. • I will reclassify each new raster grid and set the buildable area portion zero • Complete the raster overlay analysis • I will use the raster calculator to add all of the raster layers together . The buildable lands will have a raster value of zero. • The buildable areas will be shown on a map for each sub-basin • Convert available lands to acres for each sub-basin
Methods Continued Data Integration • Add raster analysis overlay results with predicted growth trends data • Show how long it will take to achieve build out in each sub-basin • Automate the process using GIS scripts • The data analysis portion will be automated. • I will create a user interface that will allow people to change the model parameters. • Analyze the results of model and growth trends • I will run a series of LQAs using the low medium and high growth trend predictions for each sub-basin. • Create a matrix table describing how land availability is affected by the variants in the model. • Create tables and time laps maps illustrating the proliferation of new exempt water wells within each sub-basin based on the low, medium, and high number of new exempt wells computed during the analysis.
Variables within the analysis Table 2: Table showing which of the model parameters will be variable and what the choices will be.
Predicted Outcomes • Some sub-basins within WRIA 59 are nearly built out and there is little room for further residential development. Thus, the potential impact to the sub-basin from new residential development will be deminimus. • The WRIA development group will run different scenarios through the dynamic LQA and find land use solutions to potential water availability issues. • Using land use planning regulations to curb potential for new residential development will lower the impacts to the watershed. • In some sub-basins, the rate of residential development within most of the sub-basins is so low that potential impacts to the watershed over the next twenty years are negligible regardless of which LQA parameters are used. • The need for over-arching blanket water-use regulations is not necessary in most sub-basins within WRIA 59.
Predicted Outcome example Figure 3: Map of Mill Creek sub-basin showing slopes greater than 30 percent. Data provided by Stevens County. A simple raster analysis was performed on this sub-basin to demonstrate that nearly 70 percent of the sub-basin has slopes over 30 percent. It is unlikely that slopes over 30 percent will develop into residential lots.
Limitations Real-world issues: • It is difficult to account for the large timber company ownership. Currently the parcel ownership data are not stored to be able to sort be owner. If this becomes available, I will remove large timber company land from lands that are likely to develop with residential housing. • If the WRIA sub-basin maps change, the analysis will have to be retuned to fit the new sub-basins. • Funding may Affect the WRIA group’s ability to thoroughly review these data and decisions may be made without this information. Data issues: • The population projection information available from the Washington State Office of Financial Management is not available at the sub-basin level. Data are only available at the WRIA level. Numbers will have to be averaged for each sub-basin. • There is intense political debate between the WRIA planning group and state regulatory agency that may threaten the usefulness of the study results.
Conclusions • A dynamic land quantity analysis model will aid in the development of a new watershed rule in WRIA 59. • Linking Land use and watershed planning is one of the next steps in the evolution of resource protection. • If successful, this model could be translated outside of WRIA 59 to include different watersheds throughout Washington State. • Using GIS to develop a land availability model with variable inputs is more functional than preparing a static land quantity analysis because it allows all of the interest groups to negotiate the model parameters and explore various outcomes based on those decisions.
Resources Golder Associates. 2007. “Colville river watershed detailed implementation plan.” Accessed September 18, 2010. http://www.co.stevens.wa.us/Wria59/pdfs/Detailed%20Implemt/FINAL%20WRIA%2059%20DIP%20032206.pdf Washington State Department of Community, trade and economic development. “Growth Management. Accessed September 12, 2010. http://www.commerce.wa.gov/_cted/documents/id_892_publications.pdf