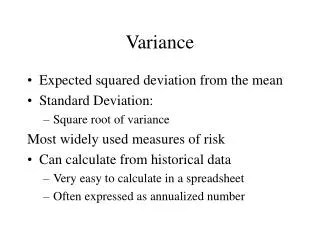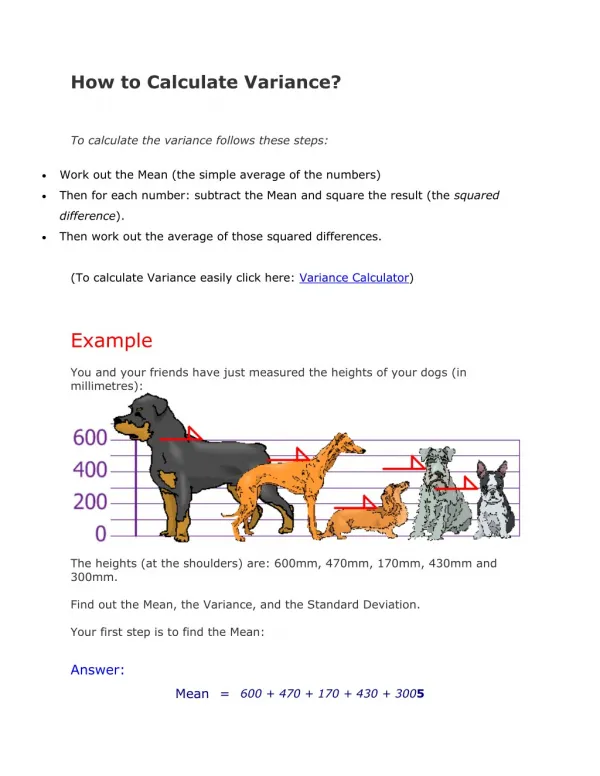
Variance Formula
Variance Formula. Probability A. The importance of probability Hypothesis testing and statistical significance Probabilistic causation - because error always exists in our sampling (sampling error) we can only deal with probabilities of being correct or incorrect in our conclusions.
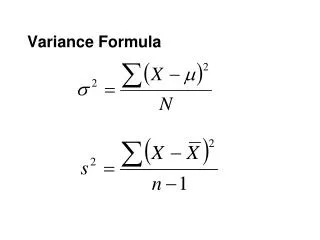

Variance Formula
E N D
Presentation Transcript
Probability A. The importance of probability Hypothesis testing and statistical significance Probabilisticcausation - because error always exists in our sampling (sampling error) we can only deal with probabilities of being correct or incorrect in our conclusions
The Normal Curve • The normal curve represents a probability distribution • The mean and standard deviation, in conjunction with the normal curve allow for more sophisticated description of the data and (as we see later) statistical analysis • For example, a school is not that interested in the raw GRE score, it is interested in how you score relative to others.
Even if the school knows the average (mean) GRE score, your raw score still doesn’t tell them much, since in a perfectly normal distribution, 50% of people will score higher than the mean. • This is where the standard deviation is so helpful. It helps interpret raw scores and understand the likelihood of a score. • So if I told you if I scored 710 on the quantitative section and the mean score is 591. Is that good?
It’s above average, but who cares. • What if I tell you the standard deviation is 148? • What does that mean? • What if I said the standard deviation is 5? • Calculating z-scores
z-scores & conversions • What is a z-score? • A measure of an observation’s distance from the mean. • The distance is measured in standard deviation units. • If a z-score is zero, it’s on the mean. • If a z-score is positive, it’s above the mean. • If a z-score is negative, it’s below the mean. • If a z-score is 1, it’s 1 SD above the mean. • If a z-score is –2, it’s 2 SDs below the mean.
Converting raw scores to z scores What is a z score? What does it represent Z = (x-µ) / σ Z = (710-563)/140 = 147/140 = 1.05 Converting z scores into raw scores X = z σ + µ [(1.05*140)+563=710]
The Normal Curve • A mathematical model or and an idealized conception of the form a distribution might have taken under certain circumstances. • A sample of means from any distribution has a normal distribution (Central Limit Theorem) • Many observations (height of adults, weight of children in Nevada, intelligence) have Normal distributions
Finding Probabilities under the Normal Curve So what % of GRE takers scored above and below 710? (Z = 1.05) - Why is this important? Infer the likelihood of a result Confidence Intervals/Margin of Error Inferential Statistics (to be cont.- ch.6-7)
pi = ≈3.14159265 e = ≈2.71 Stuff you don’t need to know:
Powersxa xb = x (a + b)xa ya = (xy)a(xa)b = x (ab) x(a/b) = bth root of (xa): Example X(1/2) = √Xx(-a) = 1 / xax(a - b) = xa / xb
Midterm • Next Thursday • Take home • Babbie Chapters 1, 2, 3, 4, 5, 6, 13 • Levin and Fox • Calculate variance and standard deviation • Calculate z-score