Download

1 / 16
180 likes | 629 Vues
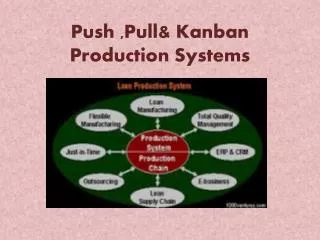
Sloan School of Management Massachusetts Institute of Technology. Impact of shortages on hybrid push-pull production systems. Paulo Gon ç alves (paulog@mit.edu). ISCM meeting– Cambridge, MA December 4, 2002. Year 7. Year 1. Year 3. Year 5. Variability in Capacity Utilization. 25%.

E N D
Sloan School of Management Massachusetts Institute of Technology Impact of shortages on hybrid push-pull production systems Paulo Gonçalves (paulog@mit.edu) ISCM meeting– Cambridge, MA December 4, 2002
Year 7 Year 1 Year 3 Year 5 Variability in Capacity Utilization 25% Capacity Utilization (All facilities) INTRODUCTION
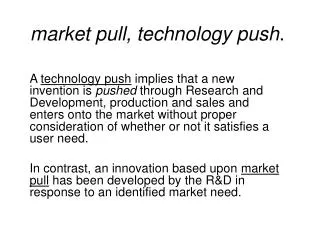
Relevance… • Just-in-time delivery is important: • “All of our [customers] are trying to operate with essentially zero inventory. They need just-in-time delivery from us and real-time feedback from the marketplace.” Alan Baldwin, VP planning and logistics [1] • But JIT is hard to accomplish: • “Demand was very high for Christmas. We came out of Q4 with lean inventory, and demand has continued to be high,” despite the historical pattern of a first-quarter letdown. [2] [1] CIO Magazine, August 15, 1998; [2] Souza (2000) “...as Intel processor shortage pinches OEM earnings” EBN Online, January 28. INTRODUCTION
… And Implications • Supplier view: supply operations manager: [3] • “If Intel does not have the part, customers will tentatively work with us, that means that they may have to wait. But if they cannot get it, they might go to AMD.” • Customer’s response: response to chip shortages: [4] • “Gateway Inc. said it will increase the number of microprocessors it buys from Advanced Micro Devices Inc. to offset Intel Corp.'s inability to match rising demand.” [3] Personal interview; [4] Hachman (2000) “Components shortage squeezing profits out of the supply chain” EBN, May 26 INTRODUCTION
Related Literature • Instability in supply chains in different contexts • Forrester (1961) • Morecroft (1980) • Sterman (1989a, 1989b) • Diehl and Sterman (1995) • Baganha and Cohen (1996) • Lee et al. (1997a, 1997b) • Anderson and Fine (1999) • Chen et al. (2000) • Graves (2000) • Hybrid systems outperform push and pull systems • Hodgson and Wang (1991a, 1991b) • Spearman and Zazanis (1992) • Simulation software for hybrid systems • Wang et al. (1996) • Wang and Xu (1997) • Huang et al. (1998) INTRODUCTION
Pure Systems • Push system • Production based on long-term forecasts • Flows determined by volume in each stock • Pull systems • Shipments based on current demand • Flows determined by downstream replenishment signals MODEL FORMULATION
Hybrid System: Semiconductor Manufacturer • Hybrid push-pull systems • Upstream = push (wafer fabrication: TPT~13 weeks) • Downstream = pull (assembly testing and packaging: TPT~1 week) • Outperform pure push and pure pull systems Replacing Shipments + Wafers Dies Chips + Finished Goods Inventory Assembly Fabrication Gross Gross WIP WIP Wafer Shipments Assembly Production Starts + + Rate + Completion + + Throughput Time Desired Customer Demand Forecasted Wafer + + Customer DELAY Starts Demand MODEL FORMULATION
Semiconductor Manufacturing Process and Products Fabrication WIP Assembly WIP Finish Goods Inventory Silicon Wafers Wafer Starts Gross Fab. Rate Gross Asbly. Rate Ship Rate Fabricated wafers Finished die Packaged chip MODEL FORMULATION
Replacing Shipments + Demand B4 Pull Finished + + + Fabrication Assembly Goods Inventory (FGI) WIP (FabWIP) WIP (AWIP) Gross Gross Wafer Assembly Shipments Production Starts Completion + Rate + + B1 R1 - B2 B3 - - + FabWIP Adjust Growth Through Adjust Adjust Adjust AWIP FabWIP FGI Service Fraction of AWIP FGI Adjust Adjust + Orders Filled + Desired - + + FabWIP* Wafer + AWIP* FGI* + B5 Starts + Customer Lost R2 Demand DELAY sales + Production + Push Market Share Forecasted DELAY + Customer Demand Full Model: Stock and Flow Diagram • Incorporate additional complexity • Inventory management at each stage • Nonlinear constraints on AWIP and FGI • Endogenous demand - low service level leads to lost sales MODEL FORMULATION
1 2 1 2 1 2 1 1 100 1 1 1 1 2 2 1 2 1 1 1 2 75 2 1 1 1 1 2 1 Fraction of Orders Filled (FoF) (%) 2 50 2 2 2 2 2 2 2 25 Pulse 20% Pulse 20% 1 1 1 1 1 1 Pulse 30% Pulse 30% 2 2 2 2 2 2 0 0 12 24 36 48 60 72 Simulation Analysis: Behavior Over Time • System oscillates in response to pulse input • Size of demand pulse matters in final system behavior • System can recover from a small pulse • Large pulse can lead to permanent decrease in performance 100 1 2 1 2 1 2 1 1 1 1 1 2 2 1 1 1 2 1 1 1 1 1 1 1 2 2 75 2 2 2 2 2 2 Market Segment Share (MSS) (%) 50 2 2 2 25 0 0 12 24 36 48 60 72 Time (Months) MODEL ANALYSIS
Analytical Approach: Eingevalue Analysis • Relies on link and loop eigenvalue elasticity: • Forrester 1982, 1983; Kampmann 1996, Gonçalves et al. 2000 • Methodology: borrows from linear systems theory • Linearize the system at every point in time • Compute eigenvalues • Map the evolution of eigenvalues over time • Analyze how eigenvalues change with each feedback loop MODEL ANALYSIS
Eigenvalues Describe System Behavior • Positive real eigenvalues lead to exponential growth • Negative real eigenvalues lead to exponential decay • Complex eigenvalues lead to oscillations Im(x) X X X X Re(x) X X MODEL ANALYSIS
B2 B5 B4 R2 Eigenvalue Analysis: Shifts in Structure • One pair of eigenvalues can evolve out of stability • Eigenvalues change dramatically when • Nonlinearities are binding • Shifts in feedback structure occur Phase 1 Phase 2 Phase 3 MODEL ANALYSIS
Eigenvalue Analysis: Active Supply Chain • Binding constraints shift the dominant feedback structure • Active supply chain changes from push-pull to push each cycle • Feedback structure of production push (R2) is highly unstable MODEL ANALYSIS
100 1 2 1 2 1 2 1 1 1 1 1 2 2 1 1 1 2 1 1 1 1 1 1 1 2 2 75 2 2 2 2 2 2 Market Segment Share (MSS) (%) 50 2 2 1 1 1 2 Policy w/ Pulse 20% 2 2 2 25 Policy w/ Pulse 30% Pulse 20% Pulse 30% 0 0 12 24 36 48 60 72 Time (Months) Eigenvalue Analysis: Policy Implementation • Implemented policy: Maintain AWIP to meet desired share • AWIP* > (1+s) AWIPReqMSS*, where s=0.05 • Implemented policy is stabilizing MODEL ANALYSIS
Insights and Implications • Managerial insights • Policy heuristic - maintain assembly inventory to meet target market share - can improve capacity utilization and service level • Shed light on tradeoff between lean inventory strategies and hybrid push-pull production systems • Theoretical contributions • Modeling customer demand endogenously leads to a different inventory strategy for the company • Stock-outs can change the system mode of operation from the desired PUSH-PULL to a PUSH system • The shift in operation mode can influence demand variability and service level • Extends linear systems theory to analyze nonlinear systems through the evolution of eigenvalues plot CONCLUSIONS