Download
1 / 85
850 likes | 1.02k Vues
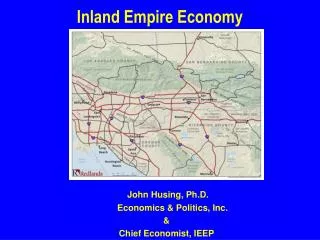
Inland Empire Economy. John Husing, Ph.D. Economics & Politics, Inc. & Chief Economist, IEEP. Three Step Growth Process Based On Interaction Of:. Population Preferences Dirt Prices. Why Southern California Population Grows. People Prefer To Live Near The Coast.

E N D
Inland Empire Economy John Husing, Ph.D. Economics & Politics, Inc. & Chief Economist, IEEP
Three Step Growth ProcessBased On Interaction Of: • Population • Preferences • Dirt • Prices
As a homeowner, would you prefer to move closer to work if it involved a townhouse or condo?(I-15 & Sr-91 Commuters, 2008) 87.5% No Answer stable over 5 years As a renter, would you prefer to move closer to work if it involved a townhouse or condo?(I-15 & Sr-91 Commuters, 2008) 72.3% No
Lack of Land or Inadequate Zoning Drives Up Coastal Prices Forcing Home Buyers & Renters to Move Inland Exhibit 20.-Home Prices, So. California Markets Median Priced New & Existing Home, 2nd Quarter 2013 $610,000 Advantage Median All Home Price San Bernardino County Price $454,000 $247,000 $428,000 $371,000 $191,000 $165,000 $263,000 $239,000 $215,000 $189,000 $24,000 San Bernardino Co. Riverside Co. Los Angeles Co. San Diego Co. Orange Co. Source: Dataquick
BUILD FREEWAYS & THEY’LL COME Don’t Build Them & They’ll Come Anyway! I-210 Delayed For 1980-2007 Years San Bernardino County went 900,000 to 2,000,000 people
Stage #1: Rapid Population Growth • People forced to move inland for affordable homes • Population Serving Jobs Only • High Desert & I-215 South are current examples
Not Enough Land … Industrial Prices Much Lower In Outlying Areas Exhibit 13.-Industrial Space Costs Differences Southern California, Sub-Markets, March 2013 Price Per Sq. Ft. 156.6% Price with 20% Cubic Factor Difference . $0.78 107.2% % Difference $0.63 $0.56 84.2% $0.48 $0.38 $0.33 $0.30 $0.26 Inland Empire Los Angeles Co. Orange Co. San Diego (non-R&D) nnn=net of taxes, insurance, common area fees Source: CB Richard Ellis
Outlying Workers Will Work For Less Not To Commute Exhibit 82.-Median Wage & Salary Percent Difference Inland Empire vs. Coastal Counties, 2010 459 Common Occupations, Under $70,000 Weight Median Pay Percent IE Pay Is Lower $35,173 $34,656 $34,089 $33,240 5.81% 4.26% 2.55% 0.0% Inland Empire San Diego Los Angeles Orange Note: Occupations in common weighted by Inland Empire Jobs Source: CA Employment Development Department, Occupational Wage Survey, Economics & Politics, Inc. calculations
Jobs:Housing Balance lmproves IE Western Edge is today’s best example
Step #3 Higher-End Migration Upscale Housing
Outlying Workers Will Work For Less Not To Commute Exhibit 98.-Median Wage & Salary Percent Difference Inland Empire vs. Coastal Counties, 2010 138 Common Occupations, $70,000 & Up Weight Median Pay Percent IE Pay Is Lower $94,806 $94,768 $93,489 $86,806 9.17% 9.22% 7.70% 0.0% Inland Empire San Diego Los Angeles Orange Note: Occupations in common weighted by Inland Empire Jobs Source: CA Employment Development Department, Occupational Wage Survey, Economics & Politics, Inc. calculations
Jobs:Housing Balance Achieved Southern California Avg. 1.20 Jobs per Occupied Dwelling
Secondary Tier Economic Development … Increase The Economic Base! Primary Tier
After Losing 8.74 Million Jobs …U.S. Job Creation Is Crawling Back Without Loss of -682,000 Government Jobs 7,495,000 Growth or 85.8%
Share Stopped EducationHigh School or Less BA or Higher Bay Area: 42% Inland Empire: 18% Lake Elsinore: 16% 37.9%
Why Not High End Jobs? Labor Force Education Dictates Type of Growth Possible
Stagnant Incomes for 23 Years Lake Elsinore $61,250 +7% -8%
Continuous Job Growth For Decades,But . . . Exhibit 3.-Wage & Salary Job Change Inland Empire, Annual Average, 1984-2013 61,533 59,275 56,467 49,850 46,008 44,692 41,025 41,483 40,692 40,567 38,325 37,642 36,775 35,467 36,533 33,292 30,050 28,925 23,083 23,025 16,917 9,758 6,342 4,575 4,633 2,508 (17,325) (46,208) -146,400 -11.4% (84,892) Sources: CA Employment Development Department, Economics & Politics, Inc. 1984 1985 1986 1987 1988 1989 1990 1991 1992 1993 1994 1995 1996 1997 1998 1999 2000 2001 2002 2003 2004 2005 2006 2007 2008 2009 2010 2011 2012 2013e
Poverty Lake Elsinore 14.5%
Water Issue Delta Smelt 20 Years Water Supply To Build Santa Ana Sucker Replacement Water Cost: $1,862,000,000 If Water Can’t Be Found … Can’t Build Large Projects
CA’s Regulatory Environment CEO’s: California is the Worst State for Business
Fulfillment Centers(John & Dan) Sales Tax Revenue to Cities (1,000,000 SF) ($5 million per year under assumption 50% of Sales Out of California)
17 Firms Looking For Space (John & Fran) 1,500,000 1,000,000 1,000,000 800,000 to 1,000,000 700,000 to 1,000,000 500,000 to 800,000 700,000 to 900,000 850,000 700,000 700,000 700,000 to 800,000 600,000 600,000 to 700,000 500,000 450,000 300,000 to 400,000 350,000 SizeJobs E-Commerce: 6,150,000 to 6,450,000 SF 5,467 to 5,733 Jobs Conventional: 5,800,000 to 6,800,000 SF 1,850 to 2,092 Jobs Total Potential: 11,950,000 to 13,250,000 SF 7,282 to 7,826 Jobs Average Square Feet Per Job Combined = 1,641 to 1,693 Source: Jones LaSalle
Industrial Vacancy Rate Recovering Everywhere! 2005/2006 2009Q3 2013Q2 Inland Empire 2.7% 12.8% 5.8% San Diego 7.0% 12.0% 9.9% Orange Co. 5.4% 6.5% 3.2% L.A. Co. 2.1% 3.2% 2.0% IE Gross Absorption Back at 12.5million Sq. Ft. But Still Under Its Long Term Average
Inland Empire Logistics Jobs 28% of All Inland Jobs … Jan-July 2012-2013
Health Care Jobs: Continuous Growth 700 500 900