Download
1 / 39
390 likes | 514 Vues
Explore energy retrofit options and telecommuting productivity for GSA HQ in Washington D.C. using VDC modeling software. Delivering comprehensive analysis and strategic recommendations.

E N D
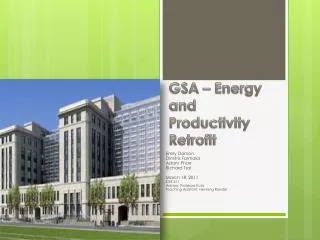
GSA – Energy and Productivity Retrofit Emily Damon Dimitris Farmakis Adam Pharr Richard Tsai March 18, 2011 CEE 211 Advisor: Professor Kunz Teaching Assistant: Henning Roedel
Confidentiality Agreement Disclaimer: “This Presentation has been prepared solely for academic purposes as a student group project for CEE211, Multi-Disciplinary Analysis & Design, at Stanford University. It is based on confidential information from an actual project of the U.S. General Service Administration (GSA) that is not meant to be shared.”
1) VDC Proposal Outline • Cover Letter • Case Example • Value Proposition • Background • Sponsor Objectives • Specific Aims • Baseline Models • Creative Alternative Models
1a) Cover Letter • Project: GSA HQ Energy and Productivity Retrofit • Big Idea: Develop process to determine best retrofit additions for energy and best space/organizational orientations changes for productivity. • Team: • Emily Damon • Dimitris Farmakis • Adam Pharr • Richard Tsai • Executive Summary • Energy Retrofit • Productivity • Space Change, Cost, Schedule Risk • Want to add value to building/GSA process
1b) Case Example Physical scope Task list - schedule Organizational Structure
1c) Value Proposition For GSA senior executives and project managers who need to decide on pursuing new construction/retrofit projects and want to improve productivity of their staff VDCenergy and organizational design modeling software and strategies provide an energy, productivity, and economic analysis plan that enables them to make informed decisions on how to organize their staff and which construction options to pursue. Compared to traditional practices VDC offers a more efficient and comprehensive method of analysis.
1d) Background • Project Objectives: • Explore Energy Retrofit Options • Explore Telecommuting Productivity • Solidify Energy and Productivity Optimization Iteration Process • VDC Approach / Relevant VDC Tools • Energy – eQUEST • Focus on mechanical systems • Productivity – SimVision • Focus on functional risks • Cost – TEI Approach • Schedule Risk – SimVision • Space Change – Revit • Located in Washington D.C. • Alternative Solution • Outsource to Building Energy Consultants • Constraints – Square Footage and Workers
1e – ii) Specific Modeling/Analysis Objectives
1e – iv-vi) Organization Model for Productivity/Schedule Risk Analysis Project phases, players, and organization structure from the client. Thus, it increases the believability of the design response and analysis. POP - Organization Model based on assumption of typical design submittal project of GSA. Model accounts for rework.
1e – iv-vi) Schedule Rework Volume Option 1 has less rework…
1e – iv-vi) Project Risks Communication risk drops but… the increased requirements for coordination increase the coordination risk…
1e – iv-vi) Inputs for Productivity • ASSUMPTIONS: • Teleconferencing isn’t effective. • Functional Risk was assumed to be 0.01 for Option 1and 0.05 for Option 2. • Physical & virtual occupants are split equally. Productivity Metrics used to determine error probabilities
1e – iv-vi) Productivity Reduced by 34% More coordination is required for increased productivity…
1e – iv-vi) Space Change Option 1 Option 2
1e – iv-vi) Energy Model – Inputs Energy Retrofit • Install new furnace • Improve efficiency from <70% to 85% • Install central AC • Remove window air conditioners! GSA Headquarters – built 1917 GSA Headquarters – lots of window air conditioners
1e – iv-vi) Energy Model - Results per year per person Energy Savings • Option 1 • $55,500/year • Option 2 • $76,000/year Breakeven Retrofit Cost $473,000 $648,000
1e – iv-vi) Total Economic Impact Table. TEI Inputs option 2 costs outweigh the savingsbecause productivity “savings” are off the chart option 1 savings outweigh the costs Table. TEI Outputs Energy Savings Energy Retrofit
1f) Specific Aims • Deliverables – Energy and organizational models and multiple analyses. • Content – POP with FFB, PBS, OBS, and WBS. • Predicted behaviors – Costs outweigh the benefits of retrofit and shorter project duration with increased FTEs. • Required hardware and software - Autodesk Revit, eQuest, Microsoft Excel, and SimVision. • Exclusions – Level B Detail. Requires further comprehensive submittal and information. • Next Steps – Incorporate sponsor feedback into next round of project iterations.
1g) POP Model – Opt. 1 Annotated product objects, are linked to the respective actors and tasks with the respective color code…
1h) POP Model – Opt. 2 The essential difference with Opt. 1 is the addition of Teleconferencing equipment to account for the virtual cooperation – telecommunication between the employees
2a) Work Breakdown Structure WBS highlights the schedule tasks included in the POP model Each task is aligned to a particular actor (see OBS) to be held responsible for it’s fulfillment.
2b) Product Breakdown Structure • PBS highlights the product objects and their breakdown according to the POP model • Objects are linked to a specific process task (see WBS) that identifies the activity that entails that object.
2c) Organization Breakdown Structure OBS highlights organizational actors highlighted in POP model General contractor, interior space designer, and energy engineer report to the chief Architect & the Owner. The actors included in the structure appear in the Process model with their respective tasks they have to undertake.
3) Rework Correlation w/ 3D Model Rework required for project drawings, specifications, and BIM model Coordination is less efficient with office barriers Coordination is more efficient in large meeting room
6) Total Economic Impact Table. TEI Inputs option 2 costs outweigh the savingsbecause productivity “savings” are off the chart option 1 savings outweigh the costs Table. TEI Outputs Energy Savings Energy Retrofit
8) PIP Model Productivity Assessment - SimVision Energy Analysis – e-Quest PoP Model – Product scope, Organizational actors, Task outline 3D BIM – Revit 2010 Energy Results Assessment - Excel Cost Estimation - Excel
10. Believability of Predictions • Energy • Analysis based on our simplified BIM • Cost Estimation • Project specific cost data were not at our disposal • Schedule Risk • Software issues • Productivity • Based completely on input values of our own judgment and assumptions. • Space change • Suggestion of plausible changes
11a) Business Recommendations for Project Problem • Energy Retrofit should be performed • Tele-commuting will result in lower productivity and higher schedule risks • An office layout with large meeting rooms is more beneficial for productivity purposes
11b) Recommendations for VDC • Improve consistency with frequent use • Account for data sharing with different programs (ex. BIM Model and e-Quest) • Implement use of new technology for analyses. E-Quest is using a 1980s engine • Offer VDC training to project teams (especially managers) • Track performance metrics throughout various project phases
11c) General Suggestions – Executive Audience • Baseline for VDC Use Involves: • Creation of checklist detailing step by step VDC procedure for each project • Identify analyses goals • Identify VDC strategies and software to achieve these goals • Create templates for performing the analyses • Save templates and perform future iterations of the analyses • Use tools such as PIP to account for the analyses and various software files
11d) General Suggestions – Executive Audience • Recommendation for VDC Use on Future Iterations: • Provide more detail to project team if analyses are sub-contracted out • Use VDC to create analyses with higher levels of detail • Incorporate client feedback into future iterations. • Modify the templates and identify VDC tools to make project iterations more accurate
12a) VDC Modeling Guidelines Energy Retrofit Iteration Focus
ORID Analysis • Objectives: What facts did you see, hear? • We observed how to effectively use VDC to address real world problems. We also learned how to adapt VDC to different areas of interests such as energy analysis and cost analysis. • Reflective Positive: What surprised or encouraged you positively? • We were surprised at how we were able to learn different VDC software and applications that seemed complex to us in the beginning of the class. By the end of the quarter, we felt we had a stronger grasp on the material. • Reflective Negative: What surprised or encouraged you negatively? • We were surprised at the brief amount of correspondence with our client and how the term project proposal was modified by the client on a weekly basis. • Interpretive: What patterns and insights did you get; what are some limits of what you saw? • We noticed that with every passing week, our ability to perform the queries and subsequent analyses was more efficient due to the opportunities presented to us in the class. • Decisional: Identify your next steps. • We intend to continue using VDC tools to maintain our skill-set. For the term project, we suggested to our client that they can use the templates for future iterations of their proposed problem. We would be happy to assist with any questions they may have.
Comments • How much time did you spend doing the homework? We spent about 10 hours doing the homework (Query #8 only, doesn’t include the bulk of the work). • What was one thing you learned in doing the homework? We learned how to use VDC for future projects similar to the ones our client proposed. • What is one thing you found confusing or irritating in doing the homework? We felt our lack of information from the client was lacking in doing the homework. However, we were satisfied with our assumptions and results. • Identify any RFIs you would like resolved by the time you do the final project submission. It would have been ideal if the client had given us a better understanding of what type of result they were looking for in the energy analysis. This could have made our proposal more accurate and fitting for the client’s needs.