Download
1 / 6
60 likes | 232 Vues
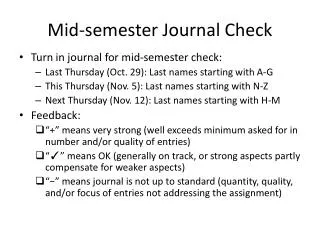
Mid-semester Journal Check. Turn in journal for mid-semester check: Last Thursday (Oct. 29): Last names starting with A-G This Thursday (Nov. 5): Last names starting with N-Z Next Thursday (Nov. 12): Last names starting with H-M Feedback:

E N D
Mid-semester Journal Check • Turn in journal for mid-semester check: • Last Thursday (Oct. 29): Last names starting with A-G • This Thursday (Nov. 5): Last names starting with N-Z • Next Thursday (Nov. 12): Last names starting with H-M • Feedback: • “+” means very strong (well exceeds minimum asked for in number and/or quality of entries) • “✓” means OK (generally on track, or strong aspects partly compensate for weaker aspects) • “−” means journal is not up to standard (quantity, quality, and/or focus of entries not addressing the assignment)
Some Things We’ve Learned about Wind and Pressure Patterns • On horizontal surfaces (such as at sea level), pressure varies from place to place. • Maps with isobars drawn on them help us visualize the spatial pressure pattern. • Pressure differences between places create a net force—the pressure-gradient (PG) force--on air, pushing toward lower pressure. The PG force pushes air into motion. • The strength of the PG force is greater where the pressure gradient (PG) is larger. • On a weather map, the spacing of isobars allows us to tell about the relative size of the PG and hence the PG force. • Once air is moving, the rotation of the earth affects the motion by apparently trying to deflect it. We account for this effect by inventing a Coriolis force. • The Coriolis force is stronger when the wind is faster. • The Coriolis force pushes on moving objects (including air) to their right in the N. Hem. and to their left in the S. Hem., but not at all at the equator. • Together, the PG force and Coriolis force tend to drive the wind close to geostrophic balance. • A wind where the balance is exactly achieved is the geostrophic wind. • The observed winds aloft are usually close to the geostrophic wind. • Winds aloft tend to blow toward the east, northeast, or southeast.
Some Things We’ve Learned (cont’d) • Near the earth’s surface, friction is a third important force (within the “friction layer”). • Friction opposes the wind, trying to slow it down. • Friction is larger over land than over water. (Land is “rougher” than water.) • The 3-way combination of PG force, Coriolis force, and friction drives winds across isobars at an angle. • As a result, surface winds tend to converge into low-pressure areas and diverge out of high-pressure areas. (We don’t see this aloft, though!) • As a result, air tends to move upward out of surface low-pressure areas and sink (subside) into surface high-pressure areas. • Regardless of the combination of forces acting on air, winds tend to be faster where the PG (and hence PG force) is stronger.
Some Things We’ve Learned (cont’d) • Radiosondes are the main instrument for measuring the state of the atmosphere aloft. • Isobaric maps (upper air maps) show observations on a constant-pressure “surface”. A common isobaric map is the 500 mb map (about half way up in the troposphere). • The height of isobaric surfaces aloft vary from place to place. • Contours of constant height above sea level help us visualize the height pattern. • We can interpret height contours as if they were isobars. • Winds are faster where height contours are closer together.
Some New Things about Winds and Pressure Patterns Aloft and Lower Tropospheric Temperature Patterns • The areas aloft with the fastest winds (say, > 60 knots; can be > 200 knots) tend to occur in the midlatitudes (30°-60° latitude). • Areas with fastest winds aloft form a narrow belt around the midlatitudes. This is the jet stream. • The jet stream has wobbles in it. These wobbles tend to migrate eastward (typically 20-25 mph). • The fastest winds tend to occur where the PG is largest, which is also where the isobaric surfaces slope the most steeply (which is where height contours on an isobaric map are closest together). • The height of an isobaric surface aloft depends on the (average) temperature below that isobaric surface. • Colder air in the lower troposphere creates lower heights (lower pressure) aloft. • Warmer air in the lower troposphere creates higher heights (and higher pressure) aloft. • Globally, it’s colder at higher latitudes (closer to the poles) and warmer at lower latitudes (closer to the equator). • So heights (pressures) aloft are lower at high latitudes and higher at lower latitudes. • So contours of height (pressure) aloft tend to oriented east/west (though with wobbles in them). • So geostrophic winds, which “blow” parallel to height/pressure contours, generally blow eastward, northeastward, or southeastward. • In the transition area between low and high latitudes--at midlatitudes--the temperature gradient is largest. • So the height gradient (pressure gradient) aloft is largest at midlatitudes. • So winds aloft are fastest at midlatitudes (and thus the jet streams).
Some New Things (cont’d) • At midlatitudes, there are also east-west variations in temperature in the lower troposphere: “tongues” of colder air from higher latitudes “protruding” equatorward alternate with tongues of warmer air protruding poleward. • So there are east-west variations in heights (pressure) aloft. • These features in the lower troposphere temperature pattern make height contours aloft wavy. The wavy features we call troughs (lower heights/pressure) and ridges (higher heights/pressure). • The (geostrophic) winds follow these contours, so the jet stream has waves (troughs, ridges) in it, too.